Tamar catchment river levels today
Are the rivers and lakes in the Tamar catchment unusually low or high?
We follow 27 water level gauges in the Tamar catchment. None read below their normal range for the date and 1 gauge above it.
How many gauges do we follow in the Tamar catchment?
27 gauges of the 2,373 we follow in the United Kingdom, as of 26 October 2026.
How many waters in the Tamar catchment have a level gauge?
15 waters with a level gauge, of the 1,149 waters we follow in the United Kingdom, as of 26 October 2026.
How many gauges read below normal for the date?
0 gauges below their normal range, of the 3 gauges with a current reading and a normal range for the date, as of 26 October 2026.
How many gauges read above normal for the date?
1 gauge above its normal range, of the 3 gauges with a current reading and a normal range for the date, as of 26 October 2026.
How the places stand today
0 places below normal and 1 place above
Which places are furthest above normal?
Which gauges do we follow in Tamar?
| Place | Reading | Against normal for the date | Change in a day |
|---|---|---|---|
| Long Brook | |||
| Plympton | 0.22 m | +0.006 m | |
| River Inny | |||
| Bealsmill | 0.939 m | +0.064 m | |
| River Kensey | |||
| Launceston | 0.552 m | -0.01 m | |
| Truscott | 0.679 m | -0.009 m | |
| River Lyd (Devon) | |||
| Lifton Park | 0.842 m | -0.005 m | |
| River Lynher | |||
| Pillaton | 0.732 m | +0.056 m | |
| River Ottery | |||
| Canworthy Water Bridge | 0.407 m | +0.04 m | |
| Trengune | 0.385 m | +0.015 m | |
| Werrington | 0.429 m | +0.059 m | |
| River Plym | |||
| Carnwood | 0.667 m | +0.126 m | |
| River Tamar | |||
| Bridge Rule | 2.015 m | -0.244 m | |
| Crowford Bridge | 1.176 m | -0.638 m | |
| Greystone Bridge | 1.116 m | -0.217 m | |
| Gunnislake | 1.278 m | within the normal range for the date | -0.279 m |
| Polson Bridge | 1.333 m | -0.164 m | |
| Tamarstone Bridge | 1.795 m | +0.179 m | |
| River Tavy | |||
| Ludbrook | 0.727 m | +0.097 m | |
| Mary Tavy | 0.657 m | +0.182 m | |
| Tavistock | 1.178 m | +0.116 m | |
| River Thrushel | |||
| Hayne Bridge | 0.529 m | within the normal range for the date | +0.002 m |
| Tinhay | 0.45 m | +0.003 m | |
| River Tiddy | |||
| Tideford | 0.336 m | in the highest 10 percent for the date | +0.001 m |
| River Wolf | |||
| Germansweek | 0.317 m | +0.016 m | |
| River Yealm | |||
| Cornwood | 0.384 m | +0.069 m | |
| Puslinch | 0.678 m | +0.122 m | |
| Tory Brook | |||
| Newnham Park | 0.456 m | +0.017 m | |
| Withy Brook | |||
| Bastreet | 0.488 m | +0.081 m | |
Keep exploring
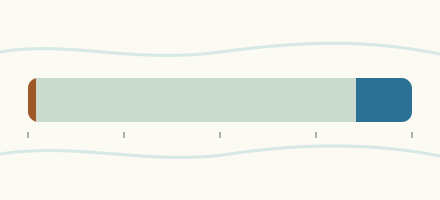 Country, United Kingdom Are the rivers and lakes in the United Kingdom unusually low or high? Every river and lake we follow here, against normal for the date.
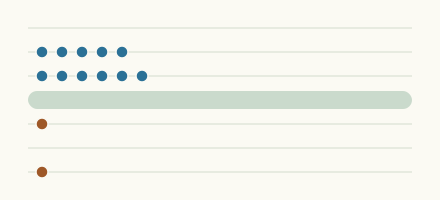 Today's list, United Kingdom Which places in the United Kingdom are furthest from normal today? The places in the United Kingdom furthest below and above normal today.
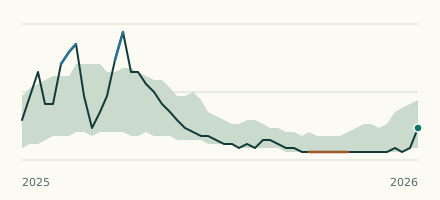 River gauge, United Kingdom Is the River Tiddy unusually high at Tideford? Level now, history, the same date in past years and each year's range.
 Records, world Which places have set a new record low or high? Record lows and highs in our data, and the newest set.