Warwickshire Avon catchment river levels today
Are the rivers and lakes in the Warwickshire Avon catchment unusually low or high?
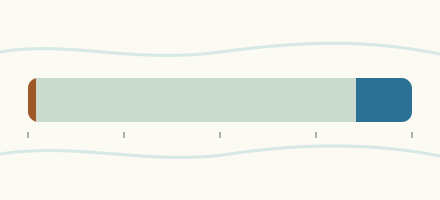
We follow 47 water level gauges in the Warwickshire Avon catchment. 1 gauge reads below its normal range for the date and none above it.
How many gauges do we follow in the Warwickshire Avon catchment?
47 gauges of the 2,373 we follow in the United Kingdom, as of 26 October 2026.
How many waters in the Warwickshire Avon catchment have a level gauge?
22 waters with a level gauge, of the 1,149 waters we follow in the United Kingdom, as of 26 October 2026.
How many gauges read below normal for the date?
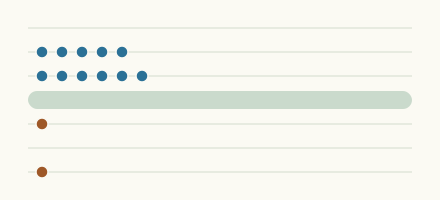
1 gauge below its normal range, of the 4 gauges with a current reading and a normal range for the date, as of 26 October 2026.
How many gauges read above normal for the date?
0 gauges above their normal range, of the 4 gauges with a current reading and a normal range for the date, as of 26 October 2026.
How the places stand today
1 place below normal and 0 places above
Which places are furthest below normal?
Which gauges do we follow in Warwickshire Avon?
| Place | Reading | Against normal for the date | Change in a day |
|---|---|---|---|
| Badsey Brook | |||
| Broadway Flood Storage Area | 0.754 m | -0.179 m | |
| Childswickham | 0.168 m | +0.013 m | |
| Offenham | 0.167 m | -0.019 m | |
| Bow Brook | |||
| Besford Bridge | 0.374 m | -0.053 m | |
| Feckenham | 0.141 m | +0.02 m | |
| Canley Brook | |||
| Sir Henry Parkes Road | 0.283 m | +0.012 m | |
| Torrington Avenue | 0.018 m | +0.008 m | |
| Carrant Brook | |||
| Tewkesbury Teddington | -0.043 m | -0.024 m | |
| Clay Coton Brook | |||
| Clay Coton | 0.586 m | -0.001 m | |
| Finham Brook | |||
| Kenilworth | 0.718 m | +0.008 m | |
| Piddle Brook (Worcestershire) | |||
| Wyre Piddle | 0.155 m | within the normal range for the date | -0.004 m |
| River Alne | |||
| Henley River | 0.428 m | -0.003 m | |
| Little Alne | 0.996 m | -0.039 m | |
| River Arrow (Warwickshire) | |||
| Broom | 0.244 m | -0.004 m | |
| Studley | 0.667 m | +0.03 m | |
| River Avon (Warwickshire) | |||
| Bidford on Avon | 1.514 m | -0.069 m | |
| Bredon | 0.866 m | -0.014 m | |
| Eckington Sluice | 2.091 m | -0.016 m | |
| Evesham | 0.604 m | within the normal range for the date | -0.048 m |
| Lilbourne | 0.131 m | -0.012 m | |
| Pershore | 3.281 m | +0.013 m | |
| Rugby | 0.613 m | -0.131 m | |
| Stareton | 0.323 m | +0.027 m | |
| Stratford | 0.689 m | -0.059 m | |
| Upper Pound | 2.352 m | -0.013 m | |
| Warwick | 1.222 m | -0.028 m | |
| River Dene | |||
| Walton | 0.33 m | -0.034 m | |
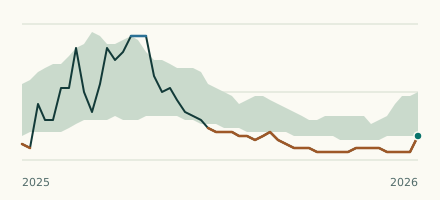
| Wellesbourne | 0.08 m | in the lowest 10 percent for the date | +0.005 m |
| River Isbourne | |||
| Hinton On Green | 0.073 m | -0.023 m | |
| Sedgeberrow | 0.276 m | -0.017 m | |
| Toddington | 0.35 m | +0.011 m | |
| River Itchen (Warwickshire) | |||
| Southam | 0.154 m | -0.009 m | |
| River Leam | |||
| Eathorpe | 0.298 m | +0.002 m | |
| Kites Hardwick | 0.267 m | -0.134 m | |
| River Sherbourne | |||
| Charterhouse Bridge | 0.194 m | +0.028 m | |
| Holyhead Road | 0.104 m | +0.034 m | |
| Hope Street, Coventry | 0.836 m | +0.257 m | |
| River Sowe | |||
| Hall Green Road | 0.716 m | +0.178 m | |
| Longford | 0.566 m | +0.065 m | |
| River Stour (Warwickshire) | |||
| Shipston | 0.308 m | within the normal range for the date | -0.058 m |
| Wimpstone | 0.621 m | -0.008 m | |
| River Swift (Warwickshire) | |||
| Churchover | 0.425 m | -0.317 m | |
| River Swilgate | |||
| Tewkesbury Tredington | 0.698 m | +0.159 m | |
| Tirle Brook | |||
| Tewkesbury Woolstone | 0.091 m | +0.029 m | |
| Wolston Brook | |||
| Wolston | 0.08 m | +0.006 m | |
| Wymans Brook | |||
| Prestbury Road | 0.028 m | -0.002 m | |
| Windyridge Road | 0.811 m | +0.074 m | |
Keep exploring
 Country, United Kingdom Are the rivers and lakes in the United Kingdom unusually low or high? Every river and lake we follow here, against normal for the date.
 Today's list, United Kingdom Which places in the United Kingdom are furthest from normal today? The places in the United Kingdom furthest below and above normal today.
 River gauge, United Kingdom Is the River Dene unusually low at Wellesbourne? Level now, history, the same date in past years and each year's range.
 Records, world Which places have set a new record low or high? Record lows and highs in our data, and the newest set.