River levels in Mississippi today
Are the rivers and lakes in Mississippi unusually low or high?
We follow 87 water level gauges in Mississippi. 23 gauges read below their normal range for the date and 1 gauge above it, not counting the 2 tide stations.
How many gauges do we follow in Mississippi?
87 gauges of the 7,007 we follow in the United States, as of 21 November 2026.
How many waters in Mississippi have a level gauge?
46 waters with a level gauge, of the 3,733 waters we follow in the United States, as of 21 November 2026.
How many gauges read below normal for the date?
23 gauges below their normal range, of the 50 gauges with a current reading and a normal range for the date, not counting the 2 tide stations, as of 21 November 2026.
How many gauges read above normal for the date?
1 gauge above its normal range, of the 50 gauges with a current reading and a normal range for the date, not counting the 2 tide stations, as of 21 November 2026.
How the places stand today
23 places below normal and 1 place above
Which places are furthest below normal?
More places
Which places are furthest above normal?
Which gauges do we follow in Mississippi?
| Place | Reading | Against normal for the date | Change in a day |
|---|---|---|---|
| Big Black River | |||
| Bentonia | 3.99 ft | in the lowest 5 percent for the date | -0.02 ft |
| Bovina | 6.44 ft | in the lowest 10 percent for the date | 0 ft |
| West | 0.92 ft | lower than any day of these dates in 34 years | +0.01 ft |
| Big Sunflower River | |||
| Anguilla | 21.32 ft | -0.02 ft | |
| Holly Bluff | 69.76 ft | +0.07 ft | |
| Sunflower | -1.05 ft | lower than any day of these dates in 26 years | 0 ft |
| Biloxi River | |||
| Lyman | 4.97 ft | -0.41 ft | |
| Wortham | -0.94 ft | in the lowest 10 percent for the date | +0.01 ft |
| Black Creek | |||
| Brooklyn | 3.93 ft | within the normal range for the date | 0 ft |
| Bogue Chitto River | |||
| Tylertown | 5.24 ft | in the lowest 5 percent for the date | 0 ft |
| Bouie Creek | |||
| Hattiesburg | 1.80 ft | within the normal range for the date | -0.01 ft |
| Buffalo River | |||
| Woodville | 3.81 ft | within the normal range for the date | -0.01 ft |
| Buttahatchie River | |||
| Aberdeen | 5.01 ft | lower than any day of these dates in 26 years | 0 ft |
| Cany Creek | |||
| Jackson | 5.61 ft | +0.04 ft | |
| Chickasawhay River | |||
| Enterprise | 4.56 ft | in the lowest 10 percent for the date | 0 ft |
| Leakesville | 7.12 ft | lower than any day of these dates in 25 years | +0.01 ft |
| Waynesboro | 3.81 ft | within the normal range for the date | -0.04 ft |
| Chunky River | |||
| Chunky | 2.66 ft | within the normal range for the date | +0.11 ft |
| Coldwater River | |||
| Arkabutla Dam | 205.56 ft | +0.12 ft | |
| Marks | 17.12 ft | -0.07 ft | |
| Olive Branch | 0.61 ft | lower than any day of these dates in 24 years | +0.01 ft |
| Sarah | -0.39 ft | -0.01 ft | |
| East Hobolochitto Creek | |||
| Caesar | 3.78 ft | within the normal range for the date | -0.02 ft |
| Escatawpa River | |||
| Orange Grove | 1.54 ft | -0.28 ft | |
| Eubanks Creek | |||
| Eubanks Ck/Jackson | 4.56 ft | 0 ft | |
| Hanging Moss Creek | |||
| Jackson | 6.83 ft | within the normal range for the date | +0.03 ft |
| Homochitto River | |||
| Rosetta | 2.76 ft | in the lowest 5 percent for the date | 0 ft |
| Jourdan River | |||
| Kiln | 1.14 ft | within the normal range for the date | -0.77 ft |
| Leaf River | |||
| Collins | 4.50 ft | within the normal range for the date | -0.01 ft |
| Hattiesburg | 1.98 ft | 0 ft | |
| McLain | 2.54 ft | in the lowest 5 percent for the date | 0 ft |
| New Augusta | 2.24 ft | within the normal range for the date | -0.01 ft |
| Little Tallahatchie River | |||
| Etta | 10.24 ft | within the normal range for the date | 0 ft |
| Luxapallila Creek | |||
| Columbus | 3.82 ft | lower than any day of these dates in 30 years | +0.02 ft |
| Lynch Creek | |||
| Jackson | 3.58 ft | +0.01 ft | |
| Mississippi Coast | |||
| Bay Waveland Yacht Club | 0.367 m above the tide table | in the highest 10 percent for the date | |
| Pascagoula NOAA Lab | 0.323 m above the tide table | in the highest 10 percent for the date | |
| Mississippi River | |||
| Friars Point | 4.52 ft | -0.43 ft | |
| Greenville | 14.65 ft | -0.15 ft | |
| Natchez | 17.09 ft | +0.03 ft | |
| Rosedale | -0.24 ft | -0.51 ft | |
| Tunica Mhoon Landing | -2.17 ft | -0.56 ft | |
| Vicksburg | 10.14 ft | -0.07 ft | |
| Noxubee River | |||
| Macon | 3.99 ft | in the lowest 5 percent for the date | +0.01 ft |
| Okatibbee Creek | |||
| Arundel | 3.10 ft | within the normal range for the date | -0.02 ft |
| Pascagoula River | |||
| Graham Ferry | 2.58 ft | within the normal range for the date | +0.06 ft |
| Merrill | 1.93 ft | in the lowest 5 percent for the date | -0.01 ft |
| Pearl River | |||
| Carthage | 3.10 ft | in the lowest 10 percent for the date | 0 ft |
| Columbia | 0.45 ft | within the normal range for the date | +0.03 ft |
| Edinburg | 1.83 ft | in the lowest 5 percent for the date | -0.01 ft |
| Jackson | 3.02 ft | lower than any day of these dates in 23 years | 0 ft |
| Lena | 4.35 ft | within the normal range for the date | +0.01 ft |
| Monticello | 4.15 ft | in the lowest 5 percent for the date | +0.05 ft |
| Philadelphia/at Burnside | 5.27 ft | within the normal range for the date | 0 ft |
| Ratliff's Ferry | 295.89 ft | within the normal range for the date | 0 ft |
| Rockport | 5.00 ft | -0.02 ft | |
| Quiver River | |||
| Doddsville | 3.67 ft | 0 ft | |
| Skuna River | |||
| Bruce | 0.84 ft | lower than any day of these dates in 36 years | 0 ft |
| Sowashee Creek | |||
| Meridian | 4.18 ft | in the lowest 5 percent for the date | -0.02 ft |
| Strong River | |||
| D'lo | 2.42 ft | +0.02 ft | |
| Tallahatchie River | |||
| Lambert | 11.52 ft | -0.81 ft | |
| Locopolis | 17.28 ft | -1.15 ft | |
| Sardis Dam | 237.55 ft | -1.85 ft | |
| Swan Lake | 10.01 ft | -0.78 ft | |
| Tangipahoa River | |||
| Osyka | 8.25 ft | within the normal range for the date | 0 ft |
| Tchoutacabouffa River | |||
| D Iberville | 1.44 ft | -0.53 ft | |
| Tibbee Creek | |||
| Tibbee | 9.36 ft | +0.02 ft | |
| Tombigbee River | |||
| Aberdeen Lock and Dam | 40.40 ft | within the normal range for the date | -0.06 ft |
| Amory | 11.46 ft | within the normal range for the date | -0.07 ft |
| Bigbee | 3.19 ft | in the lowest 5 percent for the date | 0 ft |
| Fulton | 7.50 ft | within the normal range for the date | +0.02 ft |
| Stennis Lock and Dam | 63.46 ft | in the highest 10 percent for the date | -0.05 ft |
| Town Creek | |||
| Tupelo | 0.80 ft | +0.05 ft | |
| Town Creek (Central MS) | |||
| Town Creek/Jackson | 2.23 ft | -0.01 ft | |
| Tuscolameta Creek | |||
| Walnut Grove | 12.11 ft | within the normal range for the date | 0 ft |
| West Hobolochitto Creek | |||
| McNeill | 5.88 ft | within the normal range for the date | 0 ft |
| Wolf River | |||
| Gulfport | 2.50 ft | -0.60 ft | |
| Landon | 4.32 ft | ||
| Yalobusha River | |||
| Calhoun City | 9.32 ft | within the normal range for the date | +0.04 ft |
| Whaley | 14.07 ft | -0.11 ft | |
| Yazoo River | |||
| Belzoni | 15.45 ft | -0.33 ft | |
| Greenwood | 15.63 ft | -0.26 ft | |
| Yazoo City | 13.28 ft | -0.25 ft | |
| Yockanookany River | |||
| Kosciusko | 4.52 ft | within the normal range for the date | 0 ft |
| Ofahoma | 4.60 ft | in the lowest 10 percent for the date | +0.02 ft |
| Yocona River | |||
| Enid Dam | 232.37 ft | -0.28 ft | |
| Oxford | 2.45 ft | within the normal range for the date | 0 ft |
Keep exploring
 Country, United States Are the rivers and lakes in the United States unusually low or high? Every river and lake we follow here, against normal for the date.
 Today's list, United States Which places in the United States are furthest from normal today? The places in the United States furthest below and above normal today.
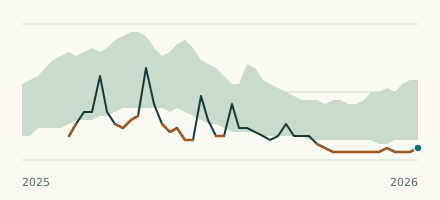 River gauge, United States Is the Luxapallila Creek unusually low at Columbus? Level now, history, the same date in past years and each year's range.
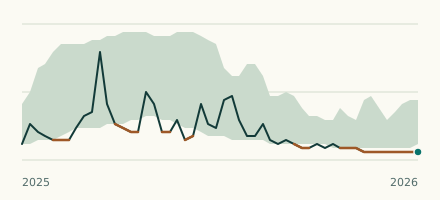 River gauge, United States Is the Big Black River unusually low at West? Level now, history, the same date in past years and each year's range.