Alabama river levels today
Are the rivers and lakes in Alabama unusually low or high?
We follow 102 water level gauges in Alabama. 31 gauges read below their normal range for the date and none above it, not counting the 8 tide stations.
How many gauges do we follow in Alabama?
102 gauges of the 7,007 we follow in the United States, as of 21 November 2026.
How many waters in Alabama have a level gauge?
60 waters with a level gauge, of the 3,733 waters we follow in the United States, as of 21 November 2026.
How many gauges read below normal for the date?
31 gauges below their normal range, of the 68 gauges with a current reading and a normal range for the date, not counting the 8 tide stations, as of 21 November 2026.
How many gauges read above normal for the date?
0 gauges above their normal range, of the 68 gauges with a current reading and a normal range for the date, not counting the 8 tide stations, as of 21 November 2026.
How the places stand today
31 places below normal and 0 places above
Which places are furthest below normal?
More places
Which gauges do we follow in Alabama?
| Place | Reading | Against normal for the date | Change in a day |
|---|---|---|---|
| Alabama Coast | |||
| Dauphin Island | 0.293 m above the tide table | in the highest 10 percent for the date | |
| Alabama River | |||
| Claiborne Dam | 6.66 ft | in the lowest 10 percent for the date | -0.01 ft |
| Henry Lock and Dam | 124.71 ft | within the normal range for the date | +0.04 ft |
| Miller's Ferry | 34.87 ft | in the lowest 10 percent for the date | -0.02 ft |
| Montgomery | 22.27 ft | within the normal range for the date | +0.32 ft |
| Selma | 18.79 ft | within the normal range for the date | +0.31 ft |
| Aldridge Creek | |||
| Farley | 2.30 ft | in the lowest 10 percent for the date | 0 ft |
| Sherwood Drive in Huntsville | 3.02 ft | in the lowest 10 percent for the date | +0.01 ft |
| Toney Drive in Huntsville | 3.11 ft | ||
| Bayou La Batre | |||
| Bayou La Batre Bridge | 0.308 m above the tide table | in the highest 10 percent for the date | |
| Bayou Sara | |||
| Saraland | 3.27 ft | -0.27 ft | |
| Big Canoe Creek | |||
| hwy 231 Ashville | 1.38 ft | in the lowest 5 percent for the date | +0.04 ft |
| Big Escambia Creek | |||
| Flomaton | 7.02 ft | 0 ft | |
| Big Nance Creek | |||
| Courtland | 1.16 ft | in the lowest 5 percent for the date | -0.01 ft |
| Big Wills Creek | |||
| Fort Payne | 3.75 ft | in the lowest 10 percent for the date | 0 ft |
| Black Warrior River | |||
| Bankhead Lock and Dam | 186.46 ft | within the normal range for the date | +0.10 ft |
| Cordova | 11.01 ft | within the normal range for the date | +0.01 ft |
| Holt Lock and Dam | 123.09 ft | in the lowest 10 percent for the date | -0.07 ft |
| Oliver Lock and Dam | 95.39 ft | within the normal range for the date | -0.14 ft |
| Selden Dam | 95.57 ft | in the lowest 10 percent for the date | -0.12 ft |
| Blackwater Creek | |||
| Manchester | 2.19 ft | in the lowest 10 percent for the date | 0 ft |
| Blue Springs Creek | |||
| Blountsville | 1.47 ft | within the normal range for the date | -0.12 ft |
| Burnt Corn Creek | |||
| Hwy 41 near Brewton 1NW | 2.88 ft | within the normal range for the date | +0.01 ft |
| Buttahatchee River | |||
| Hamilton | 1.36 ft | in the lowest 5 percent for the date | +0.02 ft |
| Cahaba River | |||
| Cahaba Heights | 1.55 ft | within the normal range for the date | -0.01 ft |
| Centreville | 0.22 ft | in the lowest 5 percent for the date | +0.01 ft |
| Marion Junction | 1.67 ft | in the lowest 10 percent for the date | -0.01 ft |
| Mountain Brook | 0.49 ft | in the lowest 5 percent for the date | +0.01 ft |
| Suttle | 2.84 ft | in the lowest 5 percent for the date | -0.02 ft |
| West Blocton | 2.00 ft | -0.03 ft | |
| Whites Chapel | 1.18 ft | within the normal range for the date | +0.01 ft |
| Cahaba Valley Creek | |||
| Pelham | 2.19 ft | in the lowest 5 percent for the date | 0 ft |
| Cahaba Valley Creek Indian Springs | |||
| Indian Trail Road | 3.69 ft | +0.01 ft | |
| Catoma Creek | |||
| Montgomery | 1.46 ft | in the lowest 5 percent for the date | 0 ft |
| Chattooga River | |||
| Gaylesville | 3.77 ft | in the lowest 5 percent for the date | 0 ft |
| Chewacla Creek | |||
| Chewalcla State Park Near Auburn | 1.56 ft | within the normal range for the date | -0.01 ft |
| Chickasaw Creek | |||
| Chickasaw Creek | 0.229 m above the tide table | within the normal range for the date | |
| Choctawhatchee River | |||
| Bellwood (CR 45) | 4.67 ft | within the normal range for the date | 0 ft |
| Geneva (SR 52) | 3.19 ft | within the normal range for the date | 0 ft |
| Newton (SR 134) | 3.71 ft | within the normal range for the date | +0.01 ft |
| Conecuh River | |||
| Brewton | 9.23 ft | within the normal range for the date | +0.98 ft |
| River Falls | 1.91 ft | in the lowest 10 percent for the date | -1.64 ft |
| Coosa River | |||
| Childersburg | 13.73 ft | within the normal range for the date | -0.14 ft |
| Gadsden | 21.06 ft | within the normal range for the date | +0.09 ft |
| Logan Martin Dam | 462.60 ft | -0.08 ft | |
| State Line, AL/GA | 12.13 ft | -0.08 ft | |
| Weiss Dam | 561.74 ft | -0.02 ft | |
| Wetumpka | 11.86 ft | within the normal range for the date | +0.26 ft |
| Dog River | |||
| Dog River Bridge | 0.293 m above the tide table | within the normal range for the date | |
| East Fowl River | |||
| East Fowl River Bridge | 0.315 m above the tide table | in the highest 10 percent for the date | |
| Escatawpa River | |||
| Wilmer | 7.99 ft | -0.02 ft | |
| Fish River | |||
| Silverhill | 0.67 ft | lower than any day of these dates in 38 years | +0.01 ft |
| Fivemile Creek | |||
| Republic | 1.13 ft | in the lowest 5 percent for the date | +0.02 ft |
| Flint River | |||
| Brownsboro | 7.28 ft | within the normal range for the date | 0 ft |
| Indian Creek | |||
| Madison | 2.74 ft | within the normal range for the date | -0.03 ft |
| Limestone Creek | |||
| Athens (Capshaw) | 1.56 ft | within the normal range for the date | 0 ft |
| Little River | |||
| Blue Pond | 1.67 ft | in the lowest 5 percent for the date | -0.01 ft |
| Locust Fork | |||
| Sayre | 2.43 ft | in the lowest 10 percent for the date | +0.01 ft |
| Lost Creek | |||
| Oakman | 1.20 ft | -0.09 ft | |
| Luxapallila Creek | |||
| Millport | 12.49 ft | ||
| Milk River | |||
| Del Bonita nr Cut Bank | 2.38 ft | -0.30 ft | |
| Mobile River | |||
| Barry Steam Plant | 3.25 ft | within the normal range for the date | -0.08 ft |
| Coast Guard Sector Mobile | 0.317 m above the tide table | within the normal range for the date | |
| Mobile State Docks | 0.291 m above the tide table | within the normal range for the date | |
| Mulberry Fork | |||
| Arkadelphia | 0.56 ft | in the lowest 10 percent for the date | -0.01 ft |
| Murder Creek | |||
| Brewton | 9.96 ft | within the normal range for the date | 0 ft |
| North Fork Milk River | |||
| International boundary near Browning | 3.72 ft | 0 ft | |
| Paint Rock River | |||
| Woodville | 1.80 ft | in the lowest 10 percent for the date | -0.02 ft |
| Pea River | |||
| Ariton (US 231) | 2.23 ft | within the normal range for the date | 0 ft |
| Elba (US 84) | -0.06 ft | in the lowest 5 percent for the date | 0 ft |
| Samson (CR 52) | 6.07 ft | within the normal range for the date | 0 ft |
| Pinhook Creek | |||
| Clinton Avenue in Huntsville | 3.42 ft | ||
| Saint Mary River | |||
| International boundary | 3.60 ft | +0.01 ft | |
| Sardine Branch | |||
| Little Rock | 0.85 ft | lower than any day of these dates in 25 years | -0.01 ft |
| Shades Creek | |||
| Greenwood | 2.01 ft | within the normal range for the date | -0.03 ft |
| Homewood | 3.50 ft | in the lowest 5 percent for the date | +0.01 ft |
| Sipsey Fork | |||
| Grayson | 2.96 ft | within the normal range for the date | 0 ft |
| Styx River | |||
| Elsanor | 1.57 ft | within the normal range for the date | -0.01 ft |
| Loxley at Smith's Landing | 3.75 ft | within the normal range for the date | 0 ft |
| Sucarnoochee River | |||
| Livingston | 0.92 ft | lower than any day of these dates in 53 years | 0 ft |
| Tallapoosa River | |||
| Heflin | 2.33 ft | 0 ft | |
| Horseshoe Bend | 3.15 ft | within the normal range for the date | +0.27 ft |
| Martin Dam | 483.42 ft | -0.08 ft | |
| Milstead | 3.40 ft | within the normal range for the date | 0 ft |
| Tallapoosa Water Plant | 4.74 ft | within the normal range for the date | -0.05 ft |
| Wadley | 3.54 ft | 0 ft | |
| Tennessee River | |||
| Decatur | 3.42 ft | -0.11 ft | |
| Florence | 8.92 ft | -0.23 ft | |
| Guntersville Dam | 14.85 ft | -0.42 ft | |
| Scottsboro | 18.68 ft | +0.11 ft | |
| Whitesburg | 3.69 ft | -0.31 ft | |
| Terrapin Creek | |||
| Ellisville | 7.13 ft | within the normal range for the date | 0 ft |
| Tombigbee River | |||
| Bevill Lock and Dam | 108.45 ft | lower than any day of these dates in 27 years | -0.12 ft |
| Coffeeville Dam | 33.31 ft | -0.25 ft | |
| Demopolis Lock and Dam | 73.72 ft | within the normal range for the date | +0.03 ft |
| Gainesville Lock and Dam | 73.67 ft | in the lowest 10 percent for the date | +0.04 ft |
| Leroy | 2.38 ft | within the normal range for the date | +0.61 ft |
| Valley Creek | |||
| Center Street | 1.49 ft | -0.01 ft | |
| Valley Creek (AL-2) | |||
| Ave W | 3.87 ft | 0 ft | |
| Village Creek | |||
| Avenue W in Ensley | 2.12 ft | within the normal range for the date | 0 ft |
| Walnut Creek | |||
| Clanton | 3.55 ft | within the normal range for the date | -0.01 ft |
| West Fowl River | |||
| West Fowl River Bridge | 0.281 m above the tide table | in the highest 10 percent for the date | |
Keep exploring
 Country, United States Are the rivers and lakes in the United States unusually low or high? Every river and lake we follow here, against normal for the date.
 Today's list, United States Which places in the United States are furthest from normal today? The places in the United States furthest below and above normal today.
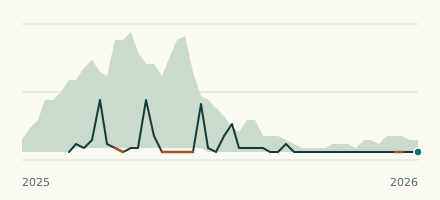 River gauge, United States Is the Tombigbee River unusually low at Bevill Lock and Dam? Level now, history, the same date in past years and each year's range.
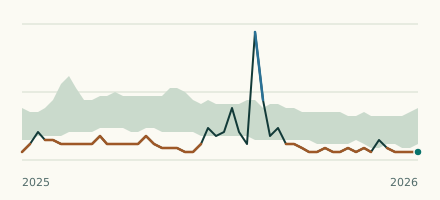 River gauge, United States Is the Sardine Branch unusually low at Little Rock? Level now, history, the same date in past years and each year's range.