Lauenburg waterway office river levels today
Are the rivers and lakes in the Lauenburg waterway office unusually low or high?
We follow 51 water level gauges in the Lauenburg waterway office. 9 gauges read below their normal range for the date and 5 gauges above it.
How many gauges do we follow in the Lauenburg waterway office?
51 gauges of the 1,158 we follow in Germany, as of 21 November 2026.
How many waters in the Lauenburg waterway office have a level gauge?
5 waters with a level gauge, of the 363 waters we follow in Germany, as of 21 November 2026.
How many gauges read below normal for the date?
9 gauges below their normal range, of the 47 gauges with a current reading and a normal range for the date, as of 21 November 2026.
How many gauges read above normal for the date?
5 gauges above their normal range, of the 47 gauges with a current reading and a normal range for the date, as of 21 November 2026.
How the places stand today
9 places below normal and 5 places above
Which places are furthest below normal?
More places
Which places are furthest above normal?
Which gauges do we follow in Lauenburg?
| Place | Reading | Against normal for the date | Change in a day |
|---|---|---|---|
| Elbe | |||
| Altengammekm 588.787 | 601 cm | within the normal range for the date | -107 cm |
| Artlenburgkm 573.86 | 415 cm | in the lowest 5 percent for the date | +6 cm |
| Bleckedekm 549.633 | 519 cm | in the lowest 10 percent for the date | +14 cm |
| Boizenburgkm 558.534 | 68 cm | in the lowest 10 percent for the date | +10 cm |
| Damnatzkm 509.35 | 132 cm | in the lowest 5 percent for the date | +2 cm |
| Dömitzkm 504.7 | 34 cm | in the lowest 5 percent for the date | -1 cm |
| Geesthachtkm 583.393 | 407 cm | within the normal range for the date | +5 cm |
| Hitzackerkm 522.639 | 97 cm | in the lowest 10 percent for the date | +9 cm |
| Hohnstorfkm 568.987 | 418 cm | lower than any day of these dates in 18 years | +6 cm |
| Neu Darchaukm 536.385 | 81 cm | ||
| Overkm 605.273 | 641 cm | within the normal range for the date | -81 cm |
| Wehr Geesthacht OPkm 585.83 | 408 cm | +4 cm | |
| Wehr Geesthacht UPkm 585.99 | 597 cm | within the normal range for the date | -103 cm |
| Zollenspiekerkm 598.159 | 605 cm | within the normal range for the date | -96 cm |
| Elbe-Lübeck Canal | |||
| Büssau UPkm 3.4 | 510 cm | within the normal range for the date | -11 cm |
| Donnerschleuse OPkm 20.722 | 1,171 cm | +3 cm | |
| Möllnkm 26.772 | 1,175 cm | in the highest 5 percent for the date | 0 cm |
| Ilmenau | |||
| Bardowick OPkm 5.624 | 473 cm | lower than any day of these dates in 11 years | +5 cm |
| Bardowick UPkm 5.687 | 532 cm | within the normal range for the date | -15 cm |
| Fahrenholz OPkm 17.64 | 786 cm | -10 cm | |
| Fahrenholz UPkm 17.71 | 616 cm | within the normal range for the date | -75 cm |
| Ilmenau Sperrwerk APkm 28.467 | 609 cm | within the normal range for the date | -94 cm |
| Lünekm 1.501 | 114 cm | within the normal range for the date | -6 cm |
| Wittorf OPkm 12.2 | 478 cm | within the normal range for the date | -12 cm |
| Wittorf UPkm 12.3 | 308 cm | within the normal range for the date | -14 cm |
| Müritz-Elde Waterway | |||
| Barkow OPkm 114.086 | 101 cm | within the normal range for the date | -1 cm |
| Bobzin OPkm 103.8 | 106 cm | within the normal range for the date | -1 cm |
| Burowkm 88.39 | 44 cm | within the normal range for the date | 0 cm |
| Dömitz OPkm 1 | 134 cm | within the normal range for the date | -5 cm |
| Dömitz UPkm 0.9 | 11 cm | in the lowest 5 percent for the date | -1 cm |
| Eldena OPkm 18.004 | 101 cm | within the normal range for the date | +1 cm |
| Findenwirunshier OPkm 5.838 | 104 cm | within the normal range for the date | 0 cm |
| Garwitz UPkm 60.655 | 99 cm | within the normal range for the date | -1 cm |
| Grabow OPkm 30.849 | 105 cm | within the normal range for the date | 0 cm |
| Güritz OPkm 22.8 | 95 cm | within the normal range for the date | -2 cm |
| Klein Laasch Wehr OPkm 42.718 | 107 cm | within the normal range for the date | +2 cm |
| Lewitz OPkm 50.599 | 97 cm | within the normal range for the date | -1 cm |
| Lübz OPkm 98.977 | 101 cm | in the highest 5 percent for the date | -5 cm |
| Malchow Wehr OPkm 65.201 | 101 cm | within the normal range for the date | +1 cm |
| Malliss OPkm 9.507 | 97 cm | within the normal range for the date | -1 cm |
| Malliss UPkm 9.431 | 108 cm | within the normal range for the date | +1 cm |
| Neu Kalliss OPkm 4.97 | 129 cm | higher than any day of these dates in 10 years | +2 cm |
| Neuburg OPkm 83.362 | 95 cm | within the normal range for the date | -11 cm |
| Neustadt Glewe OPkm 46.197 | 98 cm | within the normal range for the date | 0 cm |
| Parchim Gütekm 72.567 | 96 cm | within the normal range for the date | -3 cm |
| Plau OPkm 120.08 | 170 cm | within the normal range for the date | -1 cm |
| Plau UPkm 120.004 | 103 cm | within the normal range for the date | +1 cm |
| Warenkm 151.975 | 171 cm | within the normal range for the date | -1 cm |
| Stör Waterway | |||
| Banzkow OPkm 11.001 | 110 cm | in the highest 10 percent for the date | 0 cm |
| Banzkow UPkm 10.852 | 96 cm | within the normal range for the date | -1 cm |
| Schwerin Werderbrückekm 26.06 | 112 cm | in the highest 10 percent for the date | 0 cm |
Keep exploring
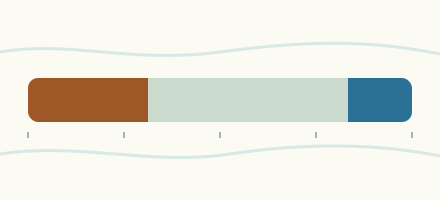 Country, Germany Are the rivers and lakes in Germany unusually low or high? Every river and lake we follow in Germany, against normal for the date.
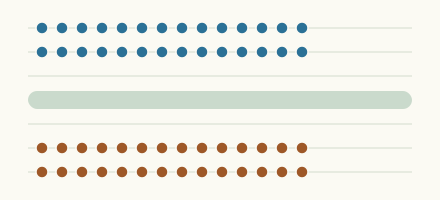 Today's list, Germany Which places in Germany are furthest from normal today? The places in Germany furthest below and above normal today.
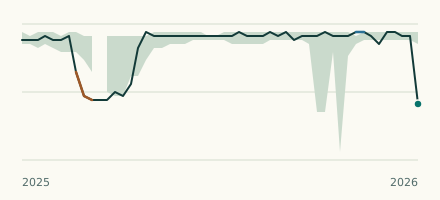 River gauge, Germany Is the Ilmenau unusually low at Bardowick OP? Level now, history, the same date in past years and each year's range.
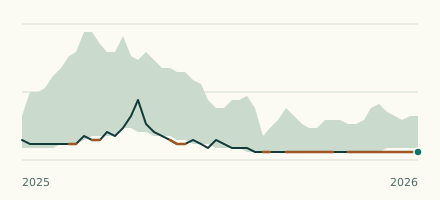 River gauge, Germany Is the Elbe unusually low at Hohnstorf? Level now, history, the same date in past years and each year's range.