Whitewood Creek water level at Whitewood (near) today
How high is the Whitewood Creek at Whitewood (near) today?
The Whitewood Creek at Whitewood (near) read 5.48 ft at .
Level now
5.48 ft
Provisional
Where the water stands
Table: where the water stands
| Level | Value |
|---|---|
| Newest reading | 5.48 ft, |
| Highest in our series | 8.16 ft |
| Lowest in our series | -0.14 ft |
- Past day
- -0.02 ft
- Past week
- -0.03 ft
The gauge reads the height of the water above a fixed zero, not the depth of the river. Its zero lies at 3,163.2 ft NAVD88.
The last 12 months, week by week
- Level
Table: The last 12 months, week by week
| Week starting | Weekly average (ft) |
|---|---|
| no value | |
| no value | |
| no value | |
| 5.60 ft | |
| no value | |
| 5.64 ft | |
| 5.57 ft | |
| 5.60 ft | |
| 5.56 ft | |
| 5.46 ft | |
| 5.46 ft | |
| 5.58 ft | |
| 5.59 ft | |
| 5.54 ft | |
| 5.62 ft | |
| 5.63 ft | |
| 5.66 ft | |
| 5.75 ft | |
| 5.74 ft | |
| 5.70 ft | |
| 5.65 ft | |
| 5.63 ft | |
| 5.60 ft | |
| 5.62 ft | |
| 5.56 ft | |
| 5.52 ft | |
| 5.67 ft | |
| 5.64 ft | |
| 5.63 ft | |
| 5.53 ft | |
| 5.49 ft | |
| 5.57 ft | |
| 5.45 ft | |
| 5.39 ft | |
| 5.36 ft | |
| 5.35 ft | |
| 5.34 ft | |
| 5.32 ft | |
| 5.33 ft | |
| 5.35 ft | |
| 5.36 ft | |
| 5.35 ft | |
| 5.32 ft | |
| 5.33 ft | |
| 5.39 ft | |
| 5.39 ft | |
| 5.40 ft | |
| 5.45 ft | |
| 5.45 ft | |
| 5.46 ft | |
| 5.56 ft | |
| 5.52 ft | |
| 5.49 ft |
Official levels
- Action stage: 10.5 ft. It is set on the National Weather Service's stage series (WNWS2/stage).the National Weather Service's stage series (WNWS2/stage). Published by NOAA National Water Prediction Service (NWPS).
- Minor flood stage: 13 ft. It is set on the National Weather Service's stage series (WNWS2/stage).the National Weather Service's stage series (WNWS2/stage). Published by NOAA National Water Prediction Service (NWPS).
- Moderate flood stage: 17 ft. It is set on the National Weather Service's stage series (WNWS2/stage).the National Weather Service's stage series (WNWS2/stage). Published by NOAA National Water Prediction Service (NWPS).
- Major flood stage: 19 ft. It is set on the National Weather Service's stage series (WNWS2/stage).the National Weather Service's stage series (WNWS2/stage). Published by NOAA National Water Prediction Service (NWPS).
Records
- Highest daily average in our series since 1 May 2018: 8.16 ft on 5 July 2019.
- Lowest daily average in our series since 1 May 2018: -0.14 ft on 13 September 2018.
Also on this water
About this gauge
Whitewood (near) is a gauge on the Whitewood Creek in South Dakota, United States.
It lies at 44.5418° N, 103.5715° W.
Its readings come from the U.S. Geological Survey.
Recent USGS data is provisional and can be revised.
The newest reading is provisional: the source may still correct it.
Keep exploring
 State, United States Are the rivers and lakes in South Dakota rising or falling? Every river and lake we follow in South Dakota.
 Country, United States Are the rivers and lakes in the United States unusually low or high? Every river and lake we follow here, against normal for the date.
 Today's list, United States Which places in the United States are furthest from normal today? The places in the United States furthest below and above normal today.
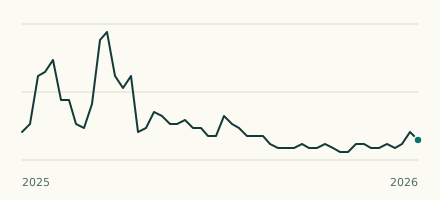 River gauge, United States How high is the Whitewood Creek at Whitewood (above) today? Level now against the normal range for the date.