Washington river levels today
Are the rivers and lakes in Washington unusually low or high?
We follow 88 water level gauges in Washington. 21 gauges read below their normal range for the date and none above it, not counting the 12 tide stations.
How many gauges do we follow in Washington?
88 gauges of the 7,007 we follow in the United States, as of 21 November 2026.
How many waters in Washington have a level gauge?
58 waters with a level gauge, of the 3,733 waters we follow in the United States, as of 21 November 2026.
How many gauges read below normal for the date?
21 gauges below their normal range, of the 41 gauges with a current reading and a normal range for the date, not counting the 12 tide stations, as of 21 November 2026.
How many gauges read above normal for the date?
0 gauges above their normal range, of the 41 gauges with a current reading and a normal range for the date, not counting the 12 tide stations, as of 21 November 2026.
How the places stand today
21 places below normal and 0 places above
Which places are furthest below normal?
More places
Which gauges do we follow in Washington?
| Place | Reading | Against normal for the date | Change in a day |
|---|---|---|---|
| Bogachiel River | |||
| La Push | 26.24 ft | within the normal range for the date | -0.27 ft |
| Calawah River | |||
| Forks | 4.20 ft | -0.22 ft | |
| Carbon River | |||
| Fairfax | 5.70 ft | in the lowest 5 percent for the date | -0.05 ft |
| Cedar River | |||
| Landsburg | 1.31 ft | in the lowest 5 percent for the date | 0 ft |
| Renton | 8.62 ft | within the normal range for the date | 0 ft |
| Chehalis River | |||
| Centralia | 152.39 ft | -0.13 ft | |
| Doty | 306.74 ft | within the normal range for the date | -0.08 ft |
| Grand Mound | 129.69 ft | within the normal range for the date | -0.14 ft |
| Porter | 31.74 ft | within the normal range for the date | -0.12 ft |
| Columbia River | |||
| Longview | 4.96 ft | +0.54 ft | |
| Priest Rapids Dam | 15.34 ft | within the normal range for the date | -4.05 ft |
| Skamokawa | 0.076 m above the tide table | within the normal range for the date | |
| Vancouver | 3.41 ft | -0.43 ft | |
| Cowlitz River | |||
| Castle Rock | 33.88 ft | -0.03 ft | |
| Kelso | 10.40 ft | 0 ft | |
| Packwood | 1.04 ft | -0.04 ft | |
| Randle | 4.20 ft | -0.08 ft | |
| Deschutes River | |||
| Rainier | 3.28 ft | -0.04 ft | |
| Duckabush River | |||
| Brinnon | 1.33 ft | within the normal range for the date | -0.14 ft |
| Dungeness River | |||
| Sequim | 2.73 ft | -0.11 ft | |
| East Fork Lewis River | |||
| Heisson | 11.07 ft | in the lowest 5 percent for the date | -0.12 ft |
| Elwha River | |||
| Elwha R | 9.83 ft | -0.09 ft | |
| Entiat River | |||
| Ardenvoir | 1.02 ft | in the lowest 5 percent for the date | -0.05 ft |
| Grays River | |||
| Covered Bridge near Rosburg | 21.54 ft | -0.15 ft | |
| Hangman/Latah Creek | |||
| Spokane | 1.17 ft | in the lowest 10 percent for the date | -0.01 ft |
| Kettle River | |||
| Ferry | 9.51 ft | within the normal range for the date | -0.05 ft |
| Klickitat River | |||
| Pitt | 3.98 ft | within the normal range for the date | -0.03 ft |
| Little Spokane River | |||
| Dartford | 2.40 ft | in the lowest 10 percent for the date | -0.01 ft |
| Methow River | |||
| Pateros | 1.59 ft | within the normal range for the date | 0 ft |
| Naches River | |||
| Cliffdell | 27.05 ft | -0.02 ft | |
| Naches | 12.87 ft | -0.06 ft | |
| Naselle River | |||
| Naselle | 4.89 ft | within the normal range for the date | -0.09 ft |
| Newaukum River | |||
| Chehalis | 193.04 ft | -0.10 ft | |
| Nisqually River | |||
| McKenna | 1.59 ft | within the normal range for the date | -0.01 ft |
| Nooksack River | |||
| Everson | 72.78 ft | in the lowest 5 percent for the date | -0.13 ft |
| Ferndale | 4.30 ft | in the lowest 10 percent for the date | -0.14 ft |
| North Cedarvillle | 138.03 ft | lower than any day of these dates in 24 years | -0.06 ft |
| Nooksack River Overflow | |||
| Emerson Rd at Everson | 89.07 ft | 0 ft | |
| SR544 Everson | 3.54 ft | 0 ft | |
| North Fork Stillaguamish River | |||
| Arlington | 2.23 ft | lower than any day of these dates in 29 years | -0.10 ft |
| Okanogan River | |||
| Tonasket | 4.11 ft | lower than any day of these dates in 26 years | -0.04 ft |
| Pilchuck River | |||
| Snohomish | 10.26 ft | within the normal range for the date | -0.06 ft |
| Puyallup River | |||
| Puyallup | 10.13 ft | -0.07 ft | |
| Salish Sea | |||
| Cherry Point | 0.195 m above the tide table | within the normal range for the date | |
| Friday Harbor | 0.229 m above the tide table | within the normal range for the date | |
| Port Angeles | 0.209 m above the tide table | within the normal range for the date | |
| Port Townsend | 0.237 m above the tide table | within the normal range for the date | |
| Seattle | 0.28 m above the tide table | in the highest 10 percent for the date | |
| Tacoma | 0.274 m above the tide table | in the highest 10 percent for the date | |
| Sanpoil River | |||
| Jack Creek | 2.17 ft | 0 ft | |
| Satsop River | |||
| Satsop | 28.81 ft | within the normal range for the date | -0.16 ft |
| Similkameen River | |||
| Nighthawk | 2.37 ft | in the lowest 5 percent for the date | +0.01 ft |
| Skagit River | |||
| Concrete | 15.75 ft | in the lowest 10 percent for the date | -0.56 ft |
| Mt Vernon | 11.95 ft | in the lowest 10 percent for the date | -0.13 ft |
| Skokomish River | |||
| Potlatch | 14.21 ft | within the normal range for the date | -0.16 ft |
| Skookumchuck River | |||
| Bucoda | 203.65 ft | 0 ft | |
| Centralia | 177.31 ft | -0.11 ft | |
| Skykomish River | |||
| Gold Bar | 5.16 ft | within the normal range for the date | -0.11 ft |
| Snake River | |||
| Anatone | 3.47 ft | within the normal range for the date | -0.04 ft |
| Snohomish River | |||
| Monroe | 1.20 ft | lower than any day of these dates in 29 years | -0.15 ft |
| Snohomish | 14.18 ft | within the normal range for the date | +0.35 ft |
| Snoqualmie River | |||
| Carnation | 45.04 ft | -0.10 ft | |
| South Fork Nooksack River | |||
| Saxon Bridge | 0.82 ft | lower than any day of these dates in 18 years | -0.05 ft |
| South Fork Palouse River | |||
| Pullman | 1.00 ft | -0.12 ft | |
| South Fork Skykomish River | |||
| Skykomish | 17.48 ft | -0.05 ft | |
| South Fork Stillaguamish River | |||
| Granite Falls | 4.29 ft | in the lowest 10 percent for the date | -0.14 ft |
| Jordan Rd. Bridge | 202.15 ft | -0.12 ft | |
| Spokane River | |||
| Spokane | 18.40 ft | in the lowest 5 percent for the date | +0.02 ft |
| Stehekin River | |||
| Stehekin | 18.60 ft | -0.02 ft | |
| Stillaguamish River | |||
| Arlington | 1.41 ft | -0.21 ft | |
| Toutle River | |||
| Tower Road near Silver Lake | 120.87 ft | -0.10 ft | |
| Walla Walla River | |||
| Touchet | 3.22 ft | within the normal range for the date | -0.04 ft |
| Washington Coast | |||
| Cape Disappointment | 0.186 m above the tide table | within the normal range for the date | |
| La Push | 0.15 m above the tide table | within the normal range for the date | |
| Neah Bay | 0.215 m above the tide table | within the normal range for the date | |
| Toke Point | 0.136 m above the tide table | within the normal range for the date | |
| Westport | 0.216 m above the tide table | within the normal range for the date | |
| Washougal River | |||
| Washougal | 5.01 ft | -0.08 ft | |
| Wenatchee River | |||
| Peshastin | 2.09 ft | in the lowest 10 percent for the date | -0.07 ft |
| West Fork Satsop River | |||
| Satsop | 206.93 ft | -0.14 ft | |
| Willapa River | |||
| Willapa | 3.69 ft | -0.11 ft | |
| Wynoochee River | |||
| Montesano | 28.53 ft | within the normal range for the date | -0.12 ft |
| Yakima River | |||
| Cle Elum | 3.97 ft | -0.03 ft | |
| Easton | 47.51 ft | -0.01 ft | |
| Horlick | 27.81 ft | -0.05 ft | |
| Kiona | 4.14 ft | in the lowest 10 percent for the date | -0.06 ft |
| Parker | 2.22 ft | -0.07 ft | |
| Umtanum | 30.68 ft | in the lowest 5 percent for the date | -0.02 ft |
Keep exploring
 Country, United States Are the rivers and lakes in the United States unusually low or high? Every river and lake we follow here, against normal for the date.
 Today's list, United States Which places in the United States are furthest from normal today? The places in the United States furthest below and above normal today.
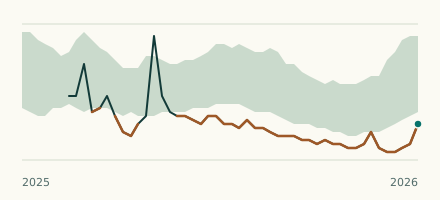 River gauge, United States Is the Nooksack River unusually low at North Cedarvillle? Level now, history, the same date in past years and each year's range.
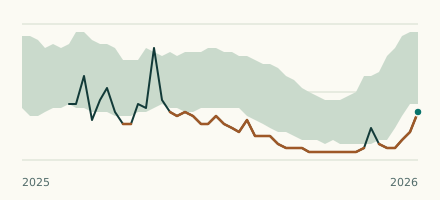 River gauge, United States Is the South Fork Nooksack River unusually low at Saxon Bridge? Level now, history, the same date in past years and each year's range.