South Carolina river levels today
Are the rivers and lakes in South Carolina unusually low or high?
We follow 107 water level gauges in South Carolina. 35 gauges read below their normal range for the date and 3 gauges above it.
How many gauges do we follow in South Carolina?
107 gauges of the 7,007 we follow in the United States, as of 21 November 2026.
How many waters in South Carolina have a level gauge?
68 waters with a level gauge, of the 3,733 waters we follow in the United States, as of 21 November 2026.
How many gauges read below normal for the date?
35 gauges below their normal range, of the 75 gauges with a current reading and a normal range for the date, not counting the 2 tide stations, as of 21 November 2026.
How many gauges read above normal for the date?
3 gauges above their normal range, of the 75 gauges with a current reading and a normal range for the date, not counting the 2 tide stations, as of 21 November 2026.
How the places stand today
35 places below normal and 3 places above
Which places are furthest below normal?
More places
Gaston Shoals Reservoir and Dam, 5 WNW BlacksburgBroad River
94.71 ft
in the lowest 5 percent for the date
Which places are furthest above normal?
Which gauges do we follow in South Carolina?
| Place | Reading | Against normal for the date | Change in a day |
|---|---|---|---|
| Allison Creek | |||
| York | 4.18 ft | within the normal range for the date | +0.01 ft |
| Atlantic Intracoastal Waterway | |||
| Aiw At Hwy 544 At Socastee | 11.60 ft | within the normal range for the date | -0.21 ft |
| Big Dutchman Creek | |||
| Mt Gallant Rd, 5 NNE Rock Hill | 1.76 ft | in the highest 10 percent for the date | +0.24 ft |
| Black Creek | |||
| Chesterfield | 3.71 ft | lower than any day of these dates in 21 years | -0.01 ft |
| Mcbee | 4.47 ft | in the lowest 10 percent for the date | +0.02 ft |
| Quinby | 2.39 ft | in the lowest 10 percent for the date | +0.03 ft |
| Black River | |||
| Kingstree | 1.47 ft | in the lowest 5 percent for the date | -0.01 ft |
| Broad River | |||
| Gaston Shoals Reservoir and Dam, 5 WNW Blacksburg | 94.71 ft | in the lowest 5 percent for the date | +0.13 ft |
| Shelby Hwy (SC 18), 4 W Blacksburg | 3.02 ft | within the normal range for the date | +0.09 ft |
| Broad River in NC/SC | |||
| Alston | 3.51 ft | within the normal range for the date | +0.02 ft |
| Carlisle | 2.80 ft | within the normal range for the date | +0.12 ft |
| Cherokee Falls | 26.25 ft | within the normal range for the date | -0.01 ft |
| Neal Shoals Reservoir | 330.89 ft | +0.01 ft | |
| Ninety Nine Islands | 100.79 ft | +0.03 ft | |
| Ninety Nine Islands Dam | 510.91 ft | +0.02 ft | |
| Brushy Creek | |||
| Old Spartanburg Rd | 1.65 ft | within the normal range for the date | 0 ft |
| Bush River | |||
| Prosperity | 2.11 ft | within the normal range for the date | -0.03 ft |
| Catawba River | |||
| Catawba | 5.27 ft | within the normal range for the date | 0 ft |
| Cedar Creek Reservoir/Rocky Ck-Cedar Ck Dam | 98.75 ft | +0.50 ft | |
| Fishing Creek Reservoir and Dam | 97.83 ft | -0.33 ft | |
| Great Falls Reservoir/Great Falls-Dearborn Dams | 97.00 ft | +0.22 ft | |
| Lake Wylie Dam | 97.12 ft | -0.03 ft | |
| Rock Hill | 3.51 ft | within the normal range for the date | 0 ft |
| Cedar Creek | |||
| Congaree NP near Gadsden | 3.07 ft | within the normal range for the date | +0.02 ft |
| Thor | 2.04 ft | within the normal range for the date | +0.01 ft |
| Chattooga River | |||
| Hwy 76 | 1.24 ft | within the normal range for the date | 0 ft |
| Church Creek | |||
| West Ashley | 1.54 ft | +0.05 ft | |
| Congaree River | |||
| Carolina Eastman | 103.30 ft | +0.10 ft | |
| Columbia | 3.53 ft | within the normal range for the date | +0.02 ft |
| Congaree National Park | 3.92 ft | within the normal range for the date | +0.02 ft |
| Coosawhatchie River | |||
| Hampton | 5.09 ft | within the normal range for the date | +0.04 ft |
| Cow Castle Creek | |||
| Bowman | 1.60 ft | +0.04 ft | |
| Edisto River | |||
| Branchville | 1.44 ft | +0.02 ft | |
| Canadys | 12.07 ft | +0.02 ft | |
| Givhans Ferry | 1.80 ft | in the lowest 10 percent for the date | -0.05 ft |
| Eighteen Mile Creek | |||
| Pendleton | 3.77 ft | within the normal range for the date | -0.02 ft |
| Enoree River | |||
| Pelham | 3.82 ft | in the lowest 10 percent for the date | -0.02 ft |
| Whitmire | 14.55 ft | in the lowest 5 percent for the date | 0 ft |
| Woodruff | 0.60 ft | lower than any day of these dates in 32 years | +0.01 ft |
| Fishing Creek | |||
| Highway 5 below York | 2.17 ft | lower than any day of these dates in 17 years | -0.01 ft |
| French Quarter Creek | |||
| Huger | 8.03 ft | -0.10 ft | |
| Gilder Creek | |||
| E Georgia Rd. | 0.80 ft | 0 ft | |
| Gills Creek | |||
| US 76 | 1.06 ft | in the lowest 5 percent for the date | +0.02 ft |
| Horse Creek | |||
| Clearwater | 10.28 ft | +0.08 ft | |
| Ireland Creek | |||
| Walterboro | 2.45 ft | +0.03 ft | |
| Kings Creek | |||
| Possum Trot Rd, 5 E Blacksburg | 2.41 ft | lower than any day of these dates in 18 years | 0 ft |
| Lake Marion | |||
| Pineville | 73.21 ft | 0 ft | |
| Lawsons Fork Creek | |||
| Spartanburg | 3.44 ft | in the lowest 10 percent for the date | +0.04 ft |
| Little Pee Dee River | |||
| Galivants Ferry | 2.74 ft | lower than any day of these dates in 38 years | -0.03 ft |
| Little River | |||
| Gordon Street in Laurens | 2.17 ft | -0.21 ft | |
| Mt Carmel | 2.80 ft | within the normal range for the date | +0.01 ft |
| Silver Street | 2.56 ft | within the normal range for the date | +0.01 ft |
| Little Saluda River | |||
| Saluda | 4.38 ft | -0.02 ft | |
| Lumber River | |||
| Nichols | 11.16 ft | -0.04 ft | |
| Lynches River | |||
| Effingham | 1.87 ft | in the lowest 5 percent for the date | -0.03 ft |
| Manchester Creek | |||
| Rock Hill | 1.61 ft | within the normal range for the date | +0.18 ft |
| McTier Creek | |||
| Monetta | 2.02 ft | in the lowest 5 percent for the date | 0 ft |
| Middle Saluda river | |||
| Cleveland | 1.58 ft | in the lowest 5 percent for the date | +0.07 ft |
| Middle Tyger River | |||
| Lyman | 2.04 ft | within the normal range for the date | +0.06 ft |
| N. Fork Edisto River | |||
| Orangeburg | 3.28 ft | within the normal range for the date | -0.01 ft |
| North Pacolet River | |||
| Fingerville | 3.06 ft | within the normal range for the date | 0 ft |
| North Rabon Creek | |||
| Hickory Tavern | 5.84 ft | in the highest 10 percent for the date | +0.01 ft |
| North Saluda River | |||
| Highway 11 | 4.61 ft | within the normal range for the date | 0 ft |
| Pacolet River | |||
| Cowpens | 1.83 ft | within the normal range for the date | -0.01 ft |
| Fingerville | 6.82 ft | within the normal range for the date | +0.01 ft |
| Saratt | 4.53 ft | -0.04 ft | |
| Pee Dee River | |||
| Cheraw | 3.40 ft | +0.58 ft | |
| Pee Dee | 2.78 ft | in the lowest 10 percent for the date | -0.14 ft |
| Reedy River | |||
| Greenville @ I-85 | 0.65 ft | in the lowest 10 percent for the date | 0 ft |
| Highway 418 | 4.19 ft | in the lowest 5 percent for the date | +0.03 ft |
| Hudson St. | 1.34 ft | -0.01 ft | |
| Waterloo | 4.36 ft | +1.22 ft | |
| Rocky Branch | |||
| Pickens Street | 2.69 ft | ||
| Whaley Street | 1.17 ft | within the normal range for the date | +0.01 ft |
| Rocky River SC | |||
| Starr | 2.97 ft | within the normal range for the date | +0.04 ft |
| Russell Lake | |||
| Savannah River | 473.75 ft | within the normal range for the date | +0.09 ft |
| Salkehatchie River | |||
| Miley | 2.24 ft | in the lowest 10 percent for the date | +0.04 ft |
| Saluda River | |||
| Chappells | 2.61 ft | within the normal range for the date | -0.09 ft |
| Old Easley Hwy (SC 124), 5 WSW Greenville | 2.37 ft | in the lowest 10 percent for the date | +0.02 ft |
| Ware Shoals | 1.95 ft | within the normal range for the date | -0.05 ft |
| West Pelzer | 4.73 ft | ||
| Williamston | 3.33 ft | -0.01 ft | |
| Santee River | |||
| Eloree | 73.08 ft | within the normal range for the date | -0.03 ft |
| Jamestown | 2.07 ft | in the lowest 10 percent for the date | -0.11 ft |
| Savannah River | |||
| Lake Hartwell | 647.21 ft | in the lowest 10 percent for the date | -0.06 ft |
| Seneca River | |||
| Jocassee Dam | 82.58 ft | -0.69 ft | |
| Keowee Dam | 96.35 ft | +0.63 ft | |
| Smith Branch | |||
| North Main St | 0.45 ft | in the lowest 10 percent for the date | +0.01 ft |
| South Carolina Coast | |||
| Charleston | 0.267 m above the tide table | within the normal range for the date | |
| Springmaid Pier | 0.188 m above the tide table | within the normal range for the date | |
| South Fork Edisto River | |||
| Bamberg | 7.23 ft | in the lowest 10 percent for the date | -0.02 ft |
| Cope | 7.46 ft | in the lowest 5 percent for the date | -0.01 ft |
| Denmark | 4.49 ft | in the lowest 10 percent for the date | -0.02 ft |
| South Pacolet River | |||
| Campobello | 3.74 ft | within the normal range for the date | +0.01 ft |
| South Rabon Creek | |||
| Gray Court | 0.85 ft | in the lowest 5 percent for the date | +0.01 ft |
| South Saluda River | |||
| Cleveland | 3.33 ft | in the highest 5 percent for the date | 0 ft |
| South Tyger River | |||
| Duncan | 4.04 ft | within the normal range for the date | +0.01 ft |
| Stevens Creek | |||
| Modoc | 2.43 ft | within the normal range for the date | +0.09 ft |
| Sugar Creek NC | |||
| Fort Mill | 4.01 ft | lower than any day of these dates in 20 years | -0.06 ft |
| Thicketty Creek | |||
| Gaffney | 2.99 ft | within the normal range for the date | +0.02 ft |
| Tools Fork Creek | |||
| Rock Hill | 1.86 ft | in the lowest 5 percent for the date | -0.01 ft |
| Twelve mile creek | |||
| Liberty | 1.61 ft | in the lowest 5 percent for the date | 0 ft |
| Tyger River | |||
| Delta | 4.19 ft | ||
| Waccamaw River | |||
| Conway | 6.75 ft | in the lowest 10 percent for the date | -0.05 ft |
| Longs | 0.54 ft | in the lowest 5 percent for the date | 0 ft |
| Wateree River | |||
| Camden | 4.95 ft | within the normal range for the date | +0.08 ft |
| Wildcat Creek | |||
| Rock Hill | 2.18 ft | in the lowest 5 percent for the date | +0.06 ft |
Keep exploring
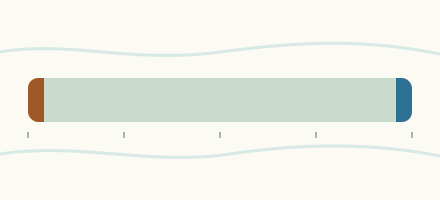 Country, United States Are the rivers and lakes in the United States unusually low or high? Every river and lake we follow here, against normal for the date.
 Today's list, United States Which places in the United States are furthest from normal today? The places in the United States furthest below and above normal today.
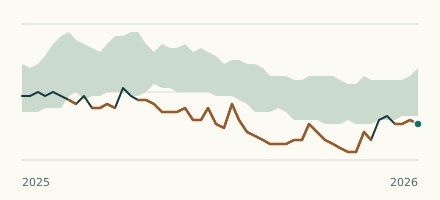 River gauge, United States Is the Kings Creek unusually low at Possum Trot Rd, 5 E Blacksburg? Level now, history, the same date in past years and each year's range.
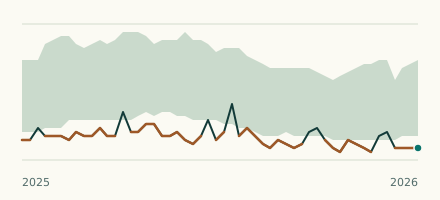 River gauge, United States Is the Enoree River unusually low at Woodruff? Level now, history, the same date in past years and each year's range.