North Dakota river levels today
Are the rivers and lakes in North Dakota unusually low or high?
We follow 59 water level gauges in North Dakota. 12 gauges read below their normal range for the date and 6 gauges above it.
How many gauges do we follow in North Dakota?
59 gauges of the 7,007 we follow in the United States, as of 21 November 2026.
How many waters in North Dakota have a level gauge?
28 waters with a level gauge, of the 3,733 waters we follow in the United States, as of 21 November 2026.
How many gauges read below normal for the date?
12 gauges below their normal range, of the 54 gauges with a current reading and a normal range for the date, as of 21 November 2026.
How many gauges read above normal for the date?
6 gauges above their normal range, of the 54 gauges with a current reading and a normal range for the date, as of 21 November 2026.
How the places stand today
12 places below normal and 6 places above
Which places are furthest below normal?
More places
Which places are furthest above normal?
More places
Which gauges do we follow in North Dakota?
| Place | Reading | Against normal for the date | Change in a day |
|---|---|---|---|
| Apple Creek | |||
| Menoken | 4.68 ft | within the normal range for the date | +0.03 ft |
| Beaver Creek (South Central ND) | |||
| Linton | 4.55 ft | within the normal range for the date | -0.01 ft |
| Cannonball River | |||
| Breien | 1.90 ft | lower than any day of these dates in 20 years | 0 ft |
| Regent | 4.72 ft | within the normal range for the date | -0.01 ft |
| Cedar Creek | |||
| Raleigh | -0.01 ft | in the lowest 5 percent for the date | -0.02 ft |
| Des Lacs River | |||
| Foxholm | 3.15 ft | lower than any day of these dates in 25 years | +0.06 ft |
| Devils Lake | |||
| Devils Lake | 49.83 ft | ||
| Eastern Stump Lake | |||
| Lakota | 49.78 ft | within the normal range for the date | +0.02 ft |
| Forest River | |||
| Minto | 1.54 ft | within the normal range for the date | 0 ft |
| Goose River | |||
| Hillsboro | 1.85 ft | within the normal range for the date | +0.01 ft |
| Heart River | |||
| Mandan | 8.92 ft | within the normal range for the date | +0.01 ft |
| James River | |||
| Grace City | 4.21 ft | within the normal range for the date | -0.03 ft |
| Hecla | 88.17 ft | within the normal range for the date | -0.14 ft |
| Jamestown | 3.56 ft | within the normal range for the date | -0.04 ft |
| Kensal | 2.04 ft | within the normal range for the date | +0.07 ft |
| LaMoure | 7.77 ft | within the normal range for the date | +0.06 ft |
| Knife River | |||
| Golden Valley | 4.10 ft | in the lowest 5 percent for the date | -0.01 ft |
| Hazen | 1.00 ft | in the lowest 10 percent for the date | +0.03 ft |
| Manning | 6.02 ft | within the normal range for the date | -0.01 ft |
| Little Missouri River | |||
| Marmarth | 0.81 ft | lower than any day of these dates in 24 years | -0.01 ft |
| Medora | 1.54 ft | within the normal range for the date | +0.02 ft |
| Watford City | 7.05 ft | in the highest 10 percent for the date | -0.09 ft |
| Little Muddy River | |||
| Williston | 4.74 ft | within the normal range for the date | 0 ft |
| Maple River | |||
| Enderlin | 1.93 ft | in the lowest 5 percent for the date | -0.02 ft |
| Frederick | 1.98 ft | +0.01 ft | |
| Mapleton (South of I-94) | 8.53 ft | +0.03 ft | |
| Missouri River | |||
| Bismarck | 3.83 ft | within the normal range for the date | +0.08 ft |
| Hensler | 11.91 ft | in the lowest 5 percent for the date | -0.05 ft |
| Mandan | 18.88 ft | in the lowest 5 percent for the date | +0.06 ft |
| Price | 16.90 ft | in the lowest 10 percent for the date | +0.01 ft |
| Schmidt | 11.87 ft | within the normal range for the date | +0.02 ft |
| the Garrison Dam | 1,823.91 ft | -0.41 ft | |
| Washburn | 7.98 ft | in the lowest 5 percent for the date | -0.03 ft |
| Williston | 13.12 ft | within the normal range for the date | +0.03 ft |
| Pembina River | |||
| Neche | 2.36 ft | within the normal range for the date | +0.03 ft |
| Walhalla | 1.58 ft | within the normal range for the date | +0.02 ft |
| Pipestem Creek | |||
| Pingree | 5.98 ft | in the highest 5 percent for the date | -0.02 ft |
| Red River of the North | |||
| Drayton | 12.88 ft | within the normal range for the date | -0.11 ft |
| Fargo | 14.58 ft | within the normal range for the date | +0.02 ft |
| Grand Forks | 16.54 ft | within the normal range for the date | -0.02 ft |
| Halstad | 5.15 ft | within the normal range for the date | -0.03 ft |
| Hickson | 10.92 ft | within the normal range for the date | +0.02 ft |
| Pembina | 13.46 ft | within the normal range for the date | -0.10 ft |
| Wahpeton | 4.91 ft | within the normal range for the date | +0.08 ft |
| Sheyenne River | |||
| Harwood | 68.95 ft | within the normal range for the date | +0.02 ft |
| Kindred | 3.93 ft | within the normal range for the date | 0 ft |
| Lisbon | 3.31 ft | within the normal range for the date | -0.12 ft |
| Valley City | 3.14 ft | within the normal range for the date | +0.01 ft |
| West Fargo Diversion | 6.37 ft | in the lowest 10 percent for the date | -0.01 ft |
| Souris River | |||
| Bantry | 5.68 ft | within the normal range for the date | -0.06 ft |
| Foxholm | 6.98 ft | in the highest 5 percent for the date | -0.29 ft |
| Minot 4NW | 5.27 ft | in the highest 5 percent for the date | -0.09 ft |
| Minot-Broadway Bridge | 42.06 ft | ||
| Sherwood | 3.60 ft | in the highest 10 percent for the date | -0.13 ft |
| Westhope | 7.93 ft | within the normal range for the date | 0 ft |
| Spring Creek | |||
| Zap | 4.78 ft | within the normal range for the date | 0 ft |
| Wild Rice River | |||
| Abercrombie | 9.98 ft | within the normal range for the date | +0.05 ft |
| Willow Creek | |||
| Willow City | 5.35 ft | within the normal range for the date | +0.07 ft |
| Wintering River | |||
| Karlsruhe | 4.78 ft | in the highest 10 percent for the date | 0 ft |
Keep exploring
 Country, United States Are the rivers and lakes in the United States unusually low or high? Every river and lake we follow here, against normal for the date.
 Today's list, United States Which places in the United States are furthest from normal today? The places in the United States furthest below and above normal today.
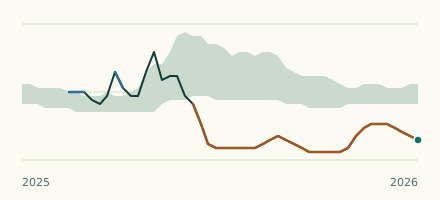 River gauge, United States Is the Des Lacs River unusually low at Foxholm? Level now, history, the same date in past years and each year's range.
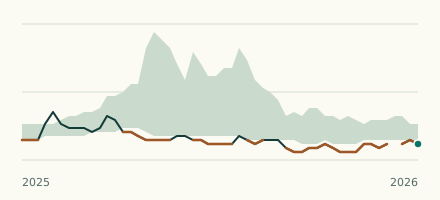 River gauge, United States Is the Little Missouri River unusually low at Marmarth? Level now, history, the same date in past years and each year's range.