New York river levels today
Are the rivers and lakes in New York unusually low or high?
We follow 191 water level gauges in New York. 9 gauges read below their normal range for the date and none above it, not counting the 3 tide stations.
How many gauges do we follow in New York?
191 gauges of the 7,007 we follow in the United States, as of 21 November 2026.
How many waters in New York have a level gauge?
107 waters with a level gauge, of the 3,733 waters we follow in the United States, as of 21 November 2026.
How many gauges read below normal for the date?
9 gauges below their normal range, of the 25 gauges with a current reading and a normal range for the date, not counting the 3 tide stations, as of 21 November 2026.
How many gauges read above normal for the date?
0 gauges above their normal range, of the 25 gauges with a current reading and a normal range for the date, not counting the 3 tide stations, as of 21 November 2026.
How the places stand today
9 places below normal and 0 places above
Which places are furthest below normal?
More places
Which gauges do we follow in New York?
| Place | Reading | Against normal for the date | Change in a day |
|---|---|---|---|
| Allegheny River | |||
| Olean | 1.09 ft | -0.01 ft | |
| Salamanca | 2.75 ft | -0.01 ft | |
| Allen Creek | |||
| Rochester | 2.52 ft | -0.01 ft | |
| Au Sable River | |||
| Au Sable Forks | 1.33 ft | -0.01 ft | |
| Battenkill | |||
| Mill at Battenville | 4.50 ft | -0.03 ft | |
| Beaver Kill | |||
| Cooks Falls | 2.37 ft | -0.08 ft | |
| Beaver River | |||
| Croghan | 2.23 ft | +0.03 ft | |
| Stillwater Reservoir | 1,665.59 ft | in the lowest 10 percent for the date | -0.07 ft |
| Black Creek | |||
| Churchville | 1.60 ft | -0.01 ft | |
| Black River | |||
| Boonville | 4.25 ft | -0.03 ft | |
| Dadville | 1.77 ft | ||
| Watertown | 3.36 ft | -0.07 ft | |
| Boquet River | |||
| Willsboro | 2.34 ft | -0.01 ft | |
| Bronx River | |||
| Bronx Botanical Gardens | 0.58 ft | 0 ft | |
| Buffalo Creek | |||
| Gardenville | 0.61 ft | +0.03 ft | |
| Bush Kill | |||
| Arkville | 4.39 ft | -0.02 ft | |
| Callicoon Creek | |||
| Callicoon | 1.08 ft | -0.02 ft | |
| Canacadea Creek | |||
| Almond Dam | 1,257.83 ft | within the normal range for the date | +0.03 ft |
| Hornell | 0.91 ft | -0.02 ft | |
| Canajoharie Creek | |||
| Canajoharie | 1.69 ft | -0.08 ft | |
| Canandaigua Lake | |||
| Canandaigua | 687.09 ft | -0.02 ft | |
| Canandaigua Outlet | |||
| Chapin | 3.21 ft | 0 ft | |
| Canasawacta Creek | |||
| Norwich Ny | 4.45 ft | -0.05 ft | |
| Canaseraga Creek | |||
| Dansville | 2.21 ft | 0 ft | |
| Canisteo River | |||
| Arkport | 1,227.08 ft | 0 ft | |
| Hornell | 0.58 ft | -0.02 ft | |
| West Cameron | 3.65 ft | -0.01 ft | |
| Cattaraugus Creek | |||
| Gowanda | 1.22 ft | -0.02 ft | |
| Cayuga Creek | |||
| Lancaster | 2.81 ft | -0.02 ft | |
| Cayuga Lake | |||
| Ithaca | 380.96 ft | within the normal range for the date | -0.03 ft |
| Mud Lock | 382.30 ft | ||
| Cazenovia Creek | |||
| Ebenezer | 2.39 ft | 0 ft | |
| Chadakoin River | |||
| Falconer | 0.34 ft | -0.01 ft | |
| Chautauqua Lake | |||
| Bemus Point | 1,306.89 ft | in the lowest 5 percent for the date | -0.01 ft |
| Chemung River | |||
| Chemung | 2.96 ft | +0.01 ft | |
| Corning | 14.61 ft | -0.01 ft | |
| Elmira | 1.04 ft | +0.01 ft | |
| Chenango River | |||
| Chenango Forks | 4.11 ft | -0.12 ft | |
| Greene | 3.58 ft | -0.20 ft | |
| Norwich | 4.40 ft | -0.06 ft | |
| Oxford | 8.52 ft | -0.13 ft | |
| Sherburne | 2.29 ft | -0.02 ft | |
| Chittenango Creek | |||
| Chittenango | 1.28 ft | -0.01 ft | |
| Cohocton River | |||
| Avoca | 2.38 ft | 0 ft | |
| Bath | 2.24 ft | -0.01 ft | |
| Campbell | 2.08 ft | 0 ft | |
| Delaware River | |||
| Barryville | 3.66 ft | -0.10 ft | |
| Dodge Creek | |||
| Portville | 2.92 ft | ||
| Dry Brook | |||
| Arkville | 2.81 ft | -0.04 ft | |
| East Branch Delaware | |||
| Hancock | 9.95 ft | -0.06 ft | |
| East Branch Delaware River | |||
| Downsville below Pepacton Dam | 2.96 ft | 0 ft | |
| Harvard | 2.80 ft | -0.05 ft | |
| Margaretville | 3.29 ft | -0.03 ft | |
| Pepacton Reservoir | 1,263.33 ft | +0.12 ft | |
| East Branch of the Ausable River | |||
| Au Sable Forks | 1.21 ft | -0.01 ft | |
| East Brook | |||
| Walton | 2.82 ft | -0.04 ft | |
| Ellicott Creek | |||
| Williamsville | 1.89 ft | 0 ft | |
| Esopus Creek | |||
| Ashokan Reservoir East | 579.17 ft | +0.08 ft | |
| Cold Brook | 5.23 ft | -0.02 ft | |
| Mount Marion | 12.71 ft | -0.02 ft | |
| Fall Creek | |||
| Ithaca | 1.14 ft | -0.06 ft | |
| Flint Creek | |||
| Phelps | 1.11 ft | -0.01 ft | |
| Genesee River | |||
| Avon - NEW USGS gage on the old railroad bridge | 14.18 ft | -0.08 ft | |
| Jones Bridge | 2.32 ft | -0.02 ft | |
| Mount Morris Dam | 586.69 ft | in the lowest 5 percent for the date | -0.04 ft |
| Portageville | 8.56 ft | -0.02 ft | |
| Rochester | 4.56 ft | +0.02 ft | |
| South Rochester at Ballantyne Bridge | 11.14 ft | 0 ft | |
| Wellsville | 4.36 ft | 0 ft | |
| Grass River | |||
| Chase Mills | 4.73 ft | -0.03 ft | |
| Great Chazy River | |||
| Perry Mills | 1.86 ft | -0.03 ft | |
| Hackensack River | |||
| West Nyack | 2.50 ft | +0.01 ft | |
| Honeoye Creek | |||
| Honeoye Falls | 2.13 ft | -0.02 ft | |
| Hoosic River | |||
| Eagle Bridge | 3.29 ft | -0.02 ft | |
| Hudson River | |||
| Albany | 0.59 ft | +0.22 ft | |
| Fort Edward | 20.90 ft | -0.03 ft | |
| Hadley | 2.52 ft | -0.02 ft | |
| Newcomb | 1.91 ft | -0.05 ft | |
| North Creek | 3.08 ft | -0.01 ft | |
| Poughkeepsie | -0.71 ft | -0.96 ft | |
| Troy | 15.90 ft | -0.44 ft | |
| Waterford | 30.13 ft | -0.01 ft | |
| Independence River | |||
| Donnattsburg | 3.60 ft | -0.03 ft | |
| Indian River | |||
| Indian Lake | 1,642.09 ft | ||
| Indian Lake (below) | 1.81 ft | 0 ft | |
| Irondequoit Creek | |||
| Rochester | 2.91 ft | -0.02 ft | |
| Keuka Lake | |||
| Penn Yan | 713.05 ft | -0.01 ft | |
| Kinderhook Creek | |||
| Rossman | 2.64 ft | -0.05 ft | |
| Lake Champlain | |||
| Port Henry | 93.80 ft | lower than any day of these dates in 13 years | |
| Rouses Point | 93.63 ft | in the lowest 5 percent for the date | -0.06 ft |
| Whitehall | 93.51 ft | in the lowest 5 percent for the date | +0.18 ft |
| Lake Erie | |||
| Buffalo | 174.032 m | within the normal range for the date | -0.193 m |
| Sturgeon Point | 174.023 m | within the normal range for the date | -0.175 m |
| Lake Ontario | |||
| Cape Vincent | 74.597 m | within the normal range for the date | -0.011 m |
| Olcott | 74.659 m | within the normal range for the date | +0.004 m |
| Oswego | 74.628 m | within the normal range for the date | -0.013 m |
| Rochester | 74.647 m | within the normal range for the date | +0.014 m |
| Little Salmon River | |||
| Bombay | 2.43 ft | -0.04 ft | |
| Mahwah River | |||
| Suffern | 1.75 ft | -0.01 ft | |
| Manor Kill | |||
| West Conesville near Gilboa | 1.41 ft | -0.03 ft | |
| Mettawee River | |||
| Middle Granville | 3.27 ft | 0 ft | |
| Mine Kill | |||
| North Blenheim | 2.30 ft | -0.02 ft | |
| Mohawk River | |||
| Cohoes | 9.94 ft | +0.20 ft | |
| Delta Dam | 526.82 ft | -0.04 ft | |
| Little Falls | 6.44 ft | +0.72 ft | |
| Schenectady (Freeman's Bridge) | 9.89 ft | -0.04 ft | |
| Utica | 6.11 ft | +1.72 ft | |
| Mongaup River | |||
| Mongaup Valley | 3.15 ft | 0 ft | |
| Moose River | |||
| McKeever | 2.91 ft | -0.07 ft | |
| Neversink River | |||
| Bridgeville | 4.84 ft | 0 ft | |
| Godeffroy | 3.47 ft | -0.02 ft | |
| Neversink Reservoir | 1,423.62 ft | -0.44 ft | |
| Neversink Reservoir (below) | 3.32 ft | 0 ft | |
| New York Coast | |||
| Kings Point | 0.083 m above the tide table | within the normal range for the date | |
| Montauk | 0.112 m above the tide table | within the normal range for the date | |
| The Battery | 0.054 m above the tide table | within the normal range for the date | |
| Niagara River | |||
| American Falls | 170.342 m | in the lowest 10 percent for the date | -0.025 m |
| Ashland Ave | 96.021 m | in the lowest 5 percent for the date | -0.618 m |
| Niagara Intake | 171.097 m | in the lowest 10 percent for the date | -0.031 m |
| Normans Kill | |||
| Albany | 3.18 ft | -0.03 ft | |
| Oatka Creek | |||
| Garbutt | 2.32 ft | 0 ft | |
| Warsaw | 3.30 ft | 0 ft | |
| Oneida Creek | |||
| Oneida | 2.20 ft | -0.03 ft | |
| Onondaga Creek | |||
| Nedrow | 1.58 ft | -0.01 ft | |
| Onondaga Flood Control Dam | 459.48 ft | -0.02 ft | |
| Onondaga Lake | |||
| Liverpool | 363.28 ft | within the normal range for the date | -0.01 ft |
| Oswegatchie River | |||
| Heuvelton | 1.50 ft | -0.03 ft | |
| Otselic River | |||
| Cincinnatus | 2.56 ft | -0.20 ft | |
| Whitney Point Dam | 973.34 ft | within the normal range for the date | -0.09 ft |
| Ouleout Creek | |||
| East Sidney Dam | 1,151.11 ft | within the normal range for the date | +0.19 ft |
| East Sidney Dam (below) | 1.89 ft | -0.31 ft | |
| Owasco Lake | |||
| Auburn | 711.50 ft | within the normal range for the date | -0.04 ft |
| Moravia Inlet | 4.03 ft | -0.04 ft | |
| Owasco Outlet | |||
| Auburn | 1.91 ft | +0.03 ft | |
| Owego Creek | |||
| Owego | 1.61 ft | -0.07 ft | |
| Ramapo River | |||
| Ramapo | 2.16 ft | 0 ft | |
| Suffern | 2.87 ft | -0.01 ft | |
| Raquette River | |||
| Piercefield | 4.51 ft | -0.06 ft | |
| South Colton | 1.77 ft | -0.01 ft | |
| Richelieu River | |||
| L'Ile-aux-Noix | 93.37 ft | -0.08 ft | |
| Rondout Creek | |||
| Lowes Corner | 2.83 ft | 0 ft | |
| Rondout Rsvr | 834.09 ft | -0.05 ft | |
| Rosendale | 9.00 ft | -0.02 ft | |
| Sacandaga River | |||
| Conklingville - Gt Sac Lk | 755.10 ft | within the normal range for the date | -0.04 ft |
| Hadley | 1.90 ft | 0 ft | |
| Hope | 2.26 ft | -0.03 ft | |
| Salmon River | |||
| Pineville | 5.36 ft | 0 ft | |
| Sandy Creek | |||
| Adams | 1.79 ft | -0.04 ft | |
| Saranac River | |||
| Plattsburgh | 3.50 ft | -0.05 ft | |
| Schoharie Creek | |||
| Breakabeen | 1.60 ft | -0.03 ft | |
| Burtonsville | 1.36 ft | -0.04 ft | |
| Gilboa Bridge | 9.72 ft | 0 ft | |
| Prattsville | 3.96 ft | -0.05 ft | |
| Schroon River | |||
| Riverbank | 2.13 ft | -0.06 ft | |
| Seneca Lake | |||
| Geneva | 443.92 ft | +0.05 ft | |
| Seneca River | |||
| Port Byron | 4.23 ft | -0.02 ft | |
| St. Lawrence River | |||
| Alexandria Bay | 74.474 m | within the normal range for the date | -0.034 m |
| Ogdensburg | 74.315 m | within the normal range for the date | -0.038 m |
| St. Regis River | |||
| Brasher Center | 6.36 ft | +0.01 ft | |
| Hogansburg 1.5 SW | 12.81 ft | -0.05 ft | |
| Susquehanna River | |||
| Bainbridge | 4.04 ft | -0.29 ft | |
| Binghamton | 3.66 ft | within the normal range for the date | -0.10 ft |
| Conklin | 4.59 ft | -0.13 ft | |
| Owego | 15.45 ft | -0.19 ft | |
| Sidney | 970.57 ft | -0.16 ft | |
| Unadilla | 4.30 ft | -0.17 ft | |
| Vestal | 6.24 ft | -0.26 ft | |
| Windsor | 5.35 ft | -0.21 ft | |
| Tenmile River | |||
| Gaylordsville | 1.10 ft | -0.01 ft | |
| Tioga River | |||
| Erwins | 0.67 ft | -0.07 ft | |
| Lindley | 3.17 ft | 0 ft | |
| Tioughnioga River | |||
| Cortland | 3.69 ft | -0.10 ft | |
| Itaska | 2.99 ft | -0.09 ft | |
| Lisle | 1.52 ft | -0.12 ft | |
| Tonawanda Creek | |||
| Attica | 3.31 ft | 0 ft | |
| Batavia | 1.59 ft | -0.01 ft | |
| Rapids | 1.38 ft | -0.04 ft | |
| Town Brook | |||
| Hobart | 1.34 ft | -0.01 ft | |
| Tremper Kill | |||
| Andes | 3.16 ft | -0.04 ft | |
| Trout Creek | |||
| Trout Creek | 3.51 ft | -0.04 ft | |
| Tuscarora Creek | |||
| South Addison | 3.59 ft | -0.01 ft | |
| Unadilla River | |||
| Rockdale | 5.21 ft | -0.09 ft | |
| Wallkill | |||
| Gardiner | 2.59 ft | -0.05 ft | |
| Wappingers Creek | |||
| Wappinger Falls | 2.83 ft | -0.02 ft | |
| West Branch Delaware River | |||
| Cannonsville Reservoir | 1,126.84 ft | +0.37 ft | |
| Delhi | 3.07 ft | -0.04 ft | |
| Hale Eddy | 2.57 ft | -0.08 ft | |
| Walton | 4.91 ft | -0.09 ft | |
| West Branch of the St. Regis River | |||
| Parishville | 1.51 ft | -0.07 ft | |
| West Canada Creek | |||
| Hinckley Dam | 1,202.25 ft | -0.27 ft | |
| Kast Bridge | 3.34 ft | 0 ft | |
Keep exploring
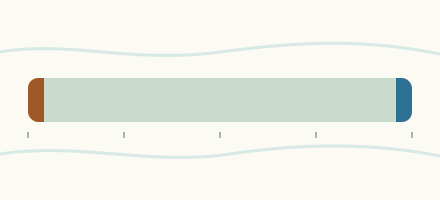 Country, United States Are the rivers and lakes in the United States unusually low or high? Every river and lake we follow here, against normal for the date.
 Today's list, United States Which places in the United States are furthest from normal today? The places in the United States furthest below and above normal today.
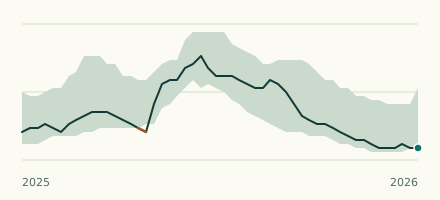 Lake gauge, United States Is Lake Champlain unusually low at Port Henry? Level now, history, the same date in past years and each year's range.
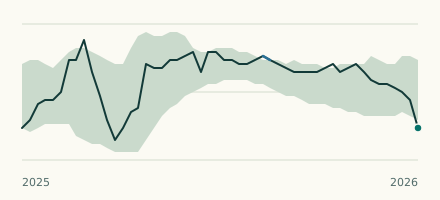 Lake gauge, United States Is the Chautauqua Lake unusually low at Bemus Point? Level now, history, the same date in past years and each year's range.