New Jersey river levels today
Are the rivers and lakes in New Jersey unusually low or high?
We follow 117 water level gauges in New Jersey. 4 gauges read below their normal range for the date and none above it, not counting the 5 tide stations.
How many gauges do we follow in New Jersey?
117 gauges of the 7,007 we follow in the United States, as of 21 November 2026.
How many waters in New Jersey have a level gauge?
69 waters with a level gauge, of the 3,733 waters we follow in the United States, as of 21 November 2026.
How many gauges read below normal for the date?
4 gauges below their normal range, of the 24 gauges with a current reading and a normal range for the date, not counting the 5 tide stations, as of 21 November 2026.
How many gauges read above normal for the date?
0 gauges above their normal range, of the 24 gauges with a current reading and a normal range for the date, not counting the 5 tide stations, as of 21 November 2026.
How the places stand today
4 places below normal and 0 places above
Which places are furthest below normal?
Which gauges do we follow in New Jersey?
| Place | Reading | Against normal for the date | Change in a day |
|---|---|---|---|
| Assunpink Creek | |||
| Clarksville | 3.96 ft | -0.02 ft | |
| Mercerville | 2.18 ft | within the normal range for the date | -0.03 ft |
| Trenton | 2.81 ft | -0.02 ft | |
| Beaver Brook | |||
| Belvidere | 1.63 ft | -0.01 ft | |
| Big Brook | |||
| Marlboro | 9.59 ft | 0 ft | |
| Bound Brook | |||
| Middlesex | 1.64 ft | +0.01 ft | |
| Cohansey River | |||
| Seeley | 2.86 ft | +0.02 ft | |
| Cooper River | |||
| Haddonfield | 1.35 ft | 0 ft | |
| Crosswicks Creek | |||
| Extonville | 3.09 ft | -0.04 ft | |
| Deep Run | |||
| Old Bridge | 6.83 ft | 0 ft | |
| Delaware Bay | |||
| Cape May | 0.143 m above the tide table | within the normal range for the date | |
| Ship John Shoal | 0.155 m above the tide table | within the normal range for the date | |
| Delaware River | |||
| Belvidere | 4.34 ft | -0.12 ft | |
| Burlington | 0.082 m above the tide table | within the normal range for the date | |
| Easton | 2.08 ft | within the normal range for the date | -0.12 ft |
| Frenchtown | 2.03 ft | within the normal range for the date | -0.13 ft |
| Riegelsville | 3.64 ft | within the normal range for the date | -0.12 ft |
| Stockton | 0.90 ft | within the normal range for the date | -0.13 ft |
| Tocks Island | 5.83 ft | within the normal range for the date | -0.10 ft |
| Trenton | 8.85 ft | -0.09 ft | |
| Washington Crossing | -1.13 ft | within the normal range for the date | -0.16 ft |
| East Branch Bass River | |||
| New Gretna | 3.64 ft | -0.01 ft | |
| Flat Brook | |||
| Flatbrookville | 2.02 ft | 0 ft | |
| Great Egg Harbor River | |||
| Folsom | 3.68 ft | -0.01 ft | |
| Green Brook | |||
| Plainfield | 1.19 ft | within the normal range for the date | +0.05 ft |
| Seeley Mills | 1.84 ft | 0 ft | |
| Green Pond Brook | |||
| Picatinny | 1.59 ft | -0.03 ft | |
| Greenwood Branch | |||
| New Lisbon | 2.25 ft | -0.03 ft | |
| Hackensack River | |||
| New Milford | 1.52 ft | +0.01 ft | |
| Rivervale | 1.67 ft | 0 ft | |
| Hohokus Brook | |||
| Ho-Ho-Kus | 1.40 ft | -0.01 ft | |
| Lamington (Black) River | |||
| Burnt Mills | 2.96 ft | within the normal range for the date | -0.03 ft |
| Pottersville | 1.73 ft | -0.03 ft | |
| Lawrence Brook | |||
| Weston Mills | 15.81 ft | +0.06 ft | |
| Manalapan Brook | |||
| Spotswood | 10.12 ft | -0.02 ft | |
| Manasquan River | |||
| Allenwood | 7.32 ft | +0.02 ft | |
| Squankum | 2.63 ft | -0.01 ft | |
| Mantua Creek | |||
| Pitman | 0.35 ft | -0.03 ft | |
| Maurice River | |||
| Norma | 2.67 ft | 0 ft | |
| McDonalds Branch | |||
| McDonald's Branch | 1.10 ft | 0 ft | |
| Middle Brook | |||
| Bound Brook | 4.16 ft | lower than any day of these dates in 13 years | +0.01 ft |
| Burnt Mills | 5.86 ft | -0.02 ft | |
| Millstone River | |||
| Blackwells Mills | 1.86 ft | -0.01 ft | |
| Griggstown | 3.36 ft | within the normal range for the date | -0.03 ft |
| Millstone | 0.94 ft | within the normal range for the date | -0.03 ft |
| Weston | 1.66 ft | within the normal range for the date | -0.03 ft |
| Molly Ann Brook | |||
| N. Haledon | 3.09 ft | within the normal range for the date | 0 ft |
| Mulhockaway Creek | |||
| Clinton | 0.22 ft | 0 ft | |
| Mullica River | |||
| Batsto | 1.18 ft | -0.04 ft | |
| Musconetcong River | |||
| Bloomsbury | 1.99 ft | +0.02 ft | |
| Neshanic River | |||
| Reaville | 2.48 ft | -0.01 ft | |
| New Jersey Coast | |||
| Atlantic City | 0.134 m above the tide table | within the normal range for the date | |
| Sandy Hook | 0.11 m above the tide table | within the normal range for the date | |
| North Branch Metedeconk River | |||
| Lakewood | 3.19 ft | +0.01 ft | |
| North Branch Rancocas Creek | |||
| Iron Works Park Mount Holly | 9.06 ft | ||
| Pemberton | 1.69 ft | -0.02 ft | |
| North Branch Raritan River | |||
| Far Hills | 2.19 ft | 0 ft | |
| North Branch Village | 3.10 ft | within the normal range for the date | -0.01 ft |
| Raritan | 2.81 ft | -0.01 ft | |
| South Branch | 1.48 ft | in the lowest 10 percent for the date | +0.01 ft |
| Pascack River | |||
| Park Ridge | 2.78 ft | 0 ft | |
| Westwood | 1.50 ft | 0 ft | |
| Passaic River | |||
| Beatties Dam | 8.30 ft | within the normal range for the date | -0.08 ft |
| Chatham | 3.78 ft | -0.11 ft | |
| Clifton (Dundee Dam) | 1.10 ft | -0.05 ft | |
| Little Falls | 1.01 ft | -0.20 ft | |
| Millington | 4.89 ft | -0.07 ft | |
| Pine Brook | 13.50 ft | -0.46 ft | |
| Singac | 2.60 ft | -0.13 ft | |
| Paulins Kill | |||
| Blairstown | 1.73 ft | -0.01 ft | |
| Peckman River | |||
| Verona | -0.51 ft | lower than any day of these dates in 13 years | 0 ft |
| Pequannock River | |||
| Macopin | 2.18 ft | -0.01 ft | |
| Oak Ridge | 3.75 ft | 0 ft | |
| Riverdale | 2.06 ft | -0.01 ft | |
| Pequest River | |||
| Huntsville | 2.56 ft | -0.01 ft | |
| Pequest | 1.55 ft | -0.01 ft | |
| Pike Run | |||
| Belle Mead | 2.97 ft | +0.01 ft | |
| Pompton River | |||
| Pompton Plains | 8.07 ft | -0.04 ft | |
| Raccoon Creek | |||
| Swedesboro | 9.09 ft | -0.01 ft | |
| Rahway River | |||
| Rahway | 1.49 ft | -0.01 ft | |
| Springfield | 1.35 ft | +0.01 ft | |
| Ramapo River | |||
| Mahwah | 2.93 ft | -0.02 ft | |
| Oakland | 4.57 ft | -0.02 ft | |
| Pompton Lakes | 7.28 ft | -0.04 ft | |
| Pompton Lakes Dam | 10.32 ft | within the normal range for the date | -0.01 ft |
| Raritan River | |||
| Bound Brook | 16.99 ft | -0.04 ft | |
| Manville | 4.13 ft | -0.01 ft | |
| Rockaway River | |||
| Boonton | 305.45 ft | within the normal range for the date | -0.01 ft |
| Boonton above reservoir | 1.03 ft | -0.01 ft | |
| Boonton below reservoir | 2.13 ft | -0.06 ft | |
| Saddle River | |||
| Lodi | 2.14 ft | -0.01 ft | |
| Paramus | 1.83 ft | -0.01 ft | |
| Ridgewood | 0.81 ft | 0 ft | |
| Upper Saddle River | 1.87 ft | -0.02 ft | |
| Salem River | |||
| Woodstown | 11.11 ft | +0.01 ft | |
| Shark River | |||
| Neptune City | 1.52 ft | -0.01 ft | |
| South Branch Pennsauken Creek | |||
| Cherry Hill | 2.14 ft | +0.20 ft | |
| South Branch Rancocas Creek | |||
| Vincentown | 1.08 ft | -0.26 ft | |
| South Branch Raritan River | |||
| High Bridge | 5.91 ft | -0.01 ft | |
| Stanton | 2.45 ft | +0.03 ft | |
| South Branch Rockaway River | |||
| Whitehouse Station | 1.78 ft | +0.02 ft | |
| Southwest Branch Rancocas Creek | |||
| Medford | 3.76 ft | in the lowest 5 percent for the date | +0.08 ft |
| Spruce Run | |||
| Clinton | 1.56 ft | +0.08 ft | |
| Glen Gardner | 2.79 ft | -0.01 ft | |
| Stony Brook | |||
| North Plainfield | 1.89 ft | within the normal range for the date | +0.02 ft |
| Princeton | 1.70 ft | -0.02 ft | |
| Watchung | 9.62 ft | +0.03 ft | |
| Swimming River | |||
| Red Bank | 5.22 ft | 0 ft | |
| Third River | |||
| Bloomfield | 1.93 ft | within the normal range for the date | -0.01 ft |
| Toms River | |||
| Toms River | 3.94 ft | -0.09 ft | |
| Wanaque River | |||
| Wanaque | 1.37 ft | -0.01 ft | |
| Wanaque Reservoir elevation | 290.34 ft | within the normal range for the date | +0.15 ft |
| West Branch Middle Brook | |||
| Martinsville | 2.04 ft | +0.02 ft | |
| West Branch Wading River | |||
| Jenkins | 10.61 ft | -0.02 ft | |
| Westecunk Creek | |||
| Stafford Forge | 10.88 ft | 0 ft | |
| Whippany River | |||
| Morristown | 2.07 ft | +0.01 ft | |
| Pine Brook | 3.03 ft | -0.17 ft | |
Keep exploring
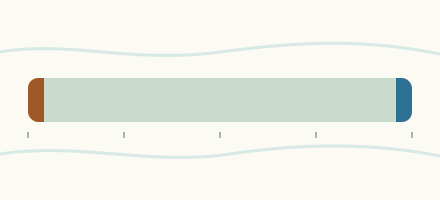 Country, United States Are the rivers and lakes in the United States unusually low or high? Every river and lake we follow here, against normal for the date.
 Today's list, United States Which places in the United States are furthest from normal today? The places in the United States furthest below and above normal today.
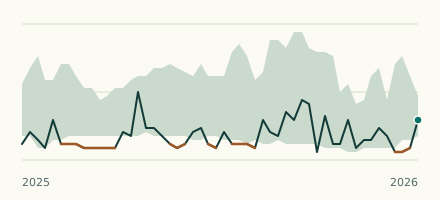 River gauge, United States Is the Peckman River unusually low at Verona? Level now, history, the same date in past years and each year's range.
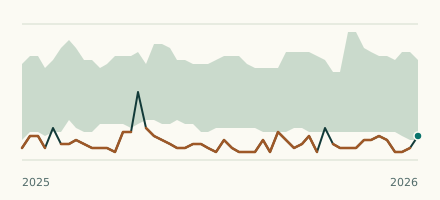 River gauge, United States Is the Middle Brook unusually low at Bound Brook? Level now, history, the same date in past years and each year's range.