River levels in Missouri today
Are the rivers and lakes in Missouri unusually low or high?
We follow 183 water level gauges in Missouri. 57 gauges read below their normal range for the date and none above it.
How many gauges do we follow in Missouri?
183 gauges of the 7,007 we follow in the United States, as of 21 November 2026.
How many waters in Missouri have a level gauge?
88 waters with a level gauge, of the 3,733 waters we follow in the United States, as of 21 November 2026.
How many gauges read below normal for the date?
57 gauges below their normal range, of the 147 gauges with a current reading and a normal range for the date, as of 21 November 2026.
How many gauges read above normal for the date?
0 gauges above their normal range, of the 147 gauges with a current reading and a normal range for the date, as of 21 November 2026.
How the places stand today
57 places below normal and 0 places above
Which places are furthest below normal?
More places
Which gauges do we follow in Missouri?
| Place | Reading | Against normal for the date | Change in a day |
|---|---|---|---|
| 102 River | |||
| Maryville | 7.02 ft | within the normal range for the date | -0.07 ft |
| Rosendale | 3.30 ft | -0.10 ft | |
| Beaver Creek | |||
| Bradleyville | 2.34 ft | within the normal range for the date | +0.01 ft |
| Bennett Spring | |||
| Bennett Spring State Park | 1.59 ft | in the lowest 10 percent for the date | +0.01 ft |
| Big Creek | |||
| Blairstown | 8.16 ft | within the normal range for the date | +0.04 ft |
| Big Piney | |||
| Edgar Springs | 2.23 ft | lower than any day of these dates in 26 years | +0.01 ft |
| Ft. Wood - East Gate | 1.71 ft | lower than any day of these dates in 25 years | 0 ft |
| Big River | |||
| Byrnesville | 1.87 ft | in the lowest 5 percent for the date | +0.01 ft |
| Richwoods | 1.89 ft | lower than any day of these dates in 42 years | +0.01 ft |
| Big Sugar Creek | |||
| Powell | 4.24 ft | within the normal range for the date | 0 ft |
| Black River | |||
| Annapolis | 3.78 ft | within the normal range for the date | 0 ft |
| Poplar Bluff | -0.05 ft | lower than any day of these dates in 26 years | 0 ft |
| Blackwater River | |||
| Blue Lick | 6.95 ft | within the normal range for the date | +0.01 ft |
| Valley City | 2.28 ft | lower than any day of these dates in 19 years | +0.01 ft |
| Blue River | |||
| 12th Street | 2.13 ft | within the normal range for the date | -0.01 ft |
| Bannister Road | 4.44 ft | within the normal range for the date | -0.08 ft |
| Blue Ridge Blvd Ext | 25.22 ft | -0.01 ft | |
| Stadium Drive | 5.62 ft | +0.02 ft | |
| Bourbeuse River | |||
| High Gate | 3.23 ft | within the normal range for the date | 0 ft |
| Union | 3.16 ft | within the normal range for the date | 0 ft |
| Brush Creek | |||
| Ward Parkway - Kansas City | 35.81 ft | within the normal range for the date | +0.01 ft |
| Bryant Creek | |||
| Tecumseh | 3.56 ft | within the normal range for the date | 0 ft |
| Buffalo Creek | |||
| Tiff City | 2.08 ft | in the lowest 5 percent for the date | +0.01 ft |
| Bull Creek | |||
| Walnut Shade | 0.89 ft | lower than any day of these dates in 27 years | 0 ft |
| Cedar Creek | |||
| Pleasant View | 2.49 ft | in the lowest 10 percent for the date | 0 ft |
| Chariton River | |||
| Novinger | 1.25 ft | within the normal range for the date | -0.85 ft |
| Prairie Hill | 2.87 ft | within the normal range for the date | -0.03 ft |
| Crooked River | |||
| Richmond | 5.58 ft | within the normal range for the date | +0.01 ft |
| Cuivre River | |||
| Old Monroe | 12.89 ft | -0.40 ft | |
| Troy | 5.30 ft | within the normal range for the date | 0 ft |
| Current River | |||
| Akers | 0.68 ft | in the lowest 10 percent for the date | +0.01 ft |
| Doniphan | -0.69 ft | lower than any day of these dates in 26 years | 0 ft |
| Montauk State Park | 1.48 ft | within the normal range for the date | 0 ft |
| Powder Mill | 1.91 ft | within the normal range for the date | 0 ft |
| Van Buren | 2.57 ft | within the normal range for the date | 0 ft |
| Dardenne Creek | |||
| O'Fallon | 0.77 ft | in the lowest 5 percent for the date | -0.05 ft |
| St. Peters | 1.29 ft | in the lowest 5 percent for the date | -0.02 ft |
| Des Moines River | |||
| St. Francisville | 10.41 ft | within the normal range for the date | +0.39 ft |
| East Fork Drywood Creek | |||
| Prairie State Park | 1.13 ft | within the normal range for the date | 0 ft |
| Eleven Point River | |||
| Bardley | 2.00 ft | within the normal range for the date | 0 ft |
| Elk River | |||
| Tiff City | 2.91 ft | 0 ft | |
| Finley River | |||
| Riverdale | 0.83 ft | within the normal range for the date | 0 ft |
| Flat Creek | |||
| Jenkins | 3.32 ft | within the normal range for the date | 0 ft |
| Fox River (IA/MO) | |||
| Wayland | 1.63 ft | within the normal range for the date | +0.01 ft |
| Gasconade River | |||
| Hazelgreen | 0.31 ft | lower than any day of these dates in 25 years | 0 ft |
| Jerome | 1.13 ft | lower than any day of these dates in 26 years | +0.01 ft |
| Rich Fountain | 2.03 ft | in the lowest 10 percent for the date | 0 ft |
| Grand River | |||
| Brunswick | 17.63 ft | ||
| Chillicothe | 5.72 ft | within the normal range for the date | -0.08 ft |
| Gallatin | 5.18 ft | within the normal range for the date | -0.07 ft |
| Pattonsburg | 3.08 ft | within the normal range for the date | -0.07 ft |
| Sumner | 8.95 ft | within the normal range for the date | -0.09 ft |
| Greer Spring | |||
| Greer | 0.44 ft | lower than any day of these dates in 21 years | 0 ft |
| Hinkson Creek | |||
| Columbia | 3.88 ft | within the normal range for the date | -0.01 ft |
| Indian Creek | |||
| Lanagan | 0.97 ft | lower than any day of these dates in 26 years | +0.01 ft |
| Jacks Fork | |||
| Alley Spring | 1.03 ft | lower than any day of these dates in 26 years | 0 ft |
| Eminence | 1.58 ft | lower than any day of these dates in 24 years | -0.01 ft |
| Mountain View | 0.63 ft | lower than any day of these dates in 25 years | +0.01 ft |
| James River | |||
| Boaz | 2.35 ft | within the normal range for the date | -0.04 ft |
| Galena | 3.77 ft | within the normal range for the date | 0 ft |
| Springfield | 3.82 ft | within the normal range for the date | 0 ft |
| Joachim Creek | |||
| DeSoto | 1.56 ft | -0.02 ft | |
| Lamine River | |||
| Otterville | 0.66 ft | within the normal range for the date | +0.01 ft |
| Lindley Creek | |||
| Polk | 2.74 ft | lower than any day of these dates in 33 years | +0.11 ft |
| Little Blue River | |||
| Lake City | 4.48 ft | within the normal range for the date | -0.01 ft |
| Lees Summit Road - Independence | 3.61 ft | 0 ft | |
| Little Niangua River | |||
| Macks Creek | 3.67 ft | within the normal range for the date | 0 ft |
| Little North Fork River | |||
| Thornfield | 2.29 ft | -0.01 ft | |
| Little Osage River | |||
| Horton | 27.78 ft | within the normal range for the date | -0.02 ft |
| Little Piney Creek | |||
| Newburg | 2.40 ft | within the normal range for the date | -0.01 ft |
| Little Platte River | |||
| Smithville | 12.31 ft | within the normal range for the date | +0.01 ft |
| Little Sac River | |||
| Morrisville | 1.61 ft | lower than any day of these dates in 30 years | -0.01 ft |
| Little St. Francis River | |||
| Fredericktown | 0.77 ft | lower than any day of these dates in 43 years | 0 ft |
| Little Sugar Creek | |||
| Pineville | 1.96 ft | lower than any day of these dates in 22 years | -0.03 ft |
| Maries River | |||
| Westphalia | 0.38 ft | lower than any day of these dates in 24 years | +0.01 ft |
| Marmaton River | |||
| Nevada | 2.17 ft | within the normal range for the date | +0.06 ft |
| Richards | 1.80 ft | in the lowest 5 percent for the date | +0.01 ft |
| Meramec River | |||
| Arnold | 5.64 ft | -0.05 ft | |
| Cook Station | 2.07 ft | within the normal range for the date | 0 ft |
| Eureka | 2.69 ft | within the normal range for the date | +0.02 ft |
| Fenton | 1.18 ft | lower than any day of these dates in 10 years | -0.01 ft |
| Pacific | -1.65 ft | in the lowest 10 percent for the date | 0 ft |
| Steelville | 1.32 ft | lower than any day of these dates in 42 years | 0 ft |
| Sullivan | 3.02 ft | within the normal range for the date | +0.01 ft |
| Valley Park | -2.91 ft | within the normal range for the date | 0 ft |
| Middle Fabius River | |||
| Ewing | 2.72 ft | in the lowest 10 percent for the date | 0 ft |
| Middle Fork Salt River | |||
| Holliday | 3.93 ft | in the lowest 10 percent for the date | 0 ft |
| Mississippi River | |||
| Birds Point | 11.27 ft | +0.46 ft | |
| Canton Lock and Dam 20 | 6.12 ft | -0.19 ft | |
| Cape Girardeau | 14.76 ft | within the normal range for the date | -0.54 ft |
| Caruthersville | 5.44 ft | -0.45 ft | |
| Clarksville Lock and Dam 24 | 17.40 ft | -0.53 ft | |
| Commerce | 9.54 ft | -0.56 ft | |
| Gregory Landing | 7.27 ft | -0.12 ft | |
| Hannibal | 11.36 ft | +0.05 ft | |
| Herculaneum | 2.77 ft | -1.46 ft | |
| LaGrange | 7.53 ft | -0.25 ft | |
| Louisiana | 12.16 ft | +0.11 ft | |
| Moccasin Springs | 13.68 ft | -0.63 ft | |
| New Madrid | 2.70 ft | -0.06 ft | |
| Price Landing | 4.52 ft | -0.48 ft | |
| Red Rock Landing | 13.29 ft | -0.85 ft | |
| Saverton Lock and Dam 22 | 7.35 ft | -0.48 ft | |
| St. Louis | 4.42 ft | within the normal range for the date | -1.72 ft |
| Tiptonville | 6.55 ft | -0.21 ft | |
| Winfield Lock and Dam 25 | 17.15 ft | -0.51 ft | |
| Missouri River | |||
| Boonville | 6.94 ft | within the normal range for the date | -0.22 ft |
| Chamois | 2.40 ft | ||
| Glasgow | 10.98 ft | within the normal range for the date | -0.19 ft |
| Hermann | 4.63 ft | within the normal range for the date | -0.22 ft |
| Jefferson City | 5.48 ft | within the normal range for the date | -0.27 ft |
| Kansas City | 8.69 ft | within the normal range for the date | -0.23 ft |
| Labadie | 3.51 ft | within the normal range for the date | -0.25 ft |
| Miami | 23.90 ft | ||
| Napoleon | 5.78 ft | in the lowest 5 percent for the date | -0.12 ft |
| Parkville | 7.20 ft | lower than any day of these dates in 10 years | -0.32 ft |
| St. Charles | 9.59 ft | within the normal range for the date | -0.27 ft |
| St. Joseph | 4.41 ft | within the normal range for the date | -0.20 ft |
| Washington | 2.65 ft | within the normal range for the date | -0.25 ft |
| Waverly | 10.27 ft | within the normal range for the date | -0.14 ft |
| Moniteau Creek | |||
| Fayette | 4.77 ft | within the normal range for the date | +0.03 ft |
| Moreau River | |||
| Jefferson City | 1.78 ft | within the normal range for the date | 0 ft |
| Niangua River | |||
| Macks Creek | 3.98 ft | within the normal range for the date | +0.01 ft |
| Tunnel Dam near Macks Creek | 1.25 ft | lower than any day of these dates in 26 years | 0 ft |
| Windyville | 0.76 ft | lower than any day of these dates in 19 years | +0.01 ft |
| Nodaway River | |||
| Burlington Junction | 5.50 ft | within the normal range for the date | -0.06 ft |
| North Fabius River | |||
| Ewing | 3.22 ft | within the normal range for the date | 0 ft |
| North Fork Salt River | |||
| Hagers Grove | -0.58 ft | within the normal range for the date | 0 ft |
| North Fork Spring River | |||
| Purcell | 2.23 ft | in the lowest 5 percent for the date | 0 ft |
| North Fork White River | |||
| Tecumseh | 2.12 ft | lower than any day of these dates in 31 years | 0 ft |
| North River | |||
| Palmyra | 3.56 ft | in the lowest 5 percent for the date | 0 ft |
| Osage River | |||
| Bagnell | 1.72 ft | within the normal range for the date | -0.03 ft |
| Bagnell Dam | 657.20 ft | 0 ft | |
| Mari-Osa Campground | 14.00 ft | ||
| Schell City | 5.58 ft | within the normal range for the date | -0.03 ft |
| St. Thomas | 2.60 ft | within the normal range for the date | +0.03 ft |
| Taberville | 8.51 ft | within the normal range for the date | 0 ft |
| Truman Dam | 705.13 ft | within the normal range for the date | -0.01 ft |
| Tuscumbia | 1.77 ft | within the normal range for the date | -0.04 ft |
| Warsaw | 25.54 ft | within the normal range for the date | -0.04 ft |
| Pearson Creek | |||
| Springfield | 2.29 ft | within the normal range for the date | 0 ft |
| Petite Saline Creek | |||
| Boonville | 3.83 ft | within the normal range for the date | -0.08 ft |
| Platte River | |||
| Agency | 7.78 ft | within the normal range for the date | -0.10 ft |
| Platte City | 1.38 ft | -0.14 ft | |
| Sharps Station | 5.89 ft | within the normal range for the date | -0.11 ft |
| Pomme de Terre River | |||
| Hermitage (above) | 2.24 ft | within the normal range for the date | 0 ft |
| Hermitage (near) | 1.78 ft | in the lowest 10 percent for the date | 0 ft |
| Polk | 1.43 ft | within the normal range for the date | 0 ft |
| Pomme De Terre River | |||
| Pomme De Terre Dam | 837.62 ft | within the normal range for the date | -0.01 ft |
| Roaring River | |||
| Roaring River State Park | 0.56 ft | within the normal range for the date | +0.01 ft |
| Roubidoux Creek | |||
| Plato 7N | 2.36 ft | within the normal range for the date | 0 ft |
| Waynesville | -0.32 ft | lower than any day of these dates in 15 years | -0.01 ft |
| Sac River | |||
| Caplinger Mills | 4.87 ft | in the lowest 5 percent for the date | +0.06 ft |
| Dadeville | 4.83 ft | within the normal range for the date | +0.01 ft |
| Highway J near Stockton | 5.63 ft | in the lowest 5 percent for the date | +0.09 ft |
| Stockton Dam | 861.93 ft | within the normal range for the date | -0.01 ft |
| Stockton Dam (below) | 4.89 ft | within the normal range for the date | +0.08 ft |
| Salt River | |||
| New London | 3.15 ft | within the normal range for the date | -0.03 ft |
| Shoal Creek | |||
| Joplin | 1.72 ft | in the lowest 5 percent for the date | -0.01 ft |
| South Creek | |||
| Springfield . | -1.12 ft | in the lowest 10 percent for the date | 0 ft |
| South Fabius River | |||
| Taylor | 1.69 ft | within the normal range for the date | -0.02 ft |
| South Fork Dry Sac River | |||
| Springfield | 1.01 ft | in the lowest 5 percent for the date | +0.01 ft |
| South Grand River | |||
| Urich | 1.72 ft | lower than any day of these dates in 11 years | |
| Spring River | |||
| Carthage | 2.47 ft | lower than any day of these dates in 24 years | 0 ft |
| LaRussell | 1.01 ft | in the lowest 10 percent for the date | +0.01 ft |
| Waco | 1.00 ft | lower than any day of these dates in 26 years | +0.01 ft |
| St. Francis River | |||
| Fisk | -1.44 ft | -0.01 ft | |
| Mill Creek | 0.79 ft | in the lowest 5 percent for the date | -0.01 ft |
| Patterson | 4.65 ft | within the normal range for the date | 0 ft |
| Roselle | 1.86 ft | +0.06 ft | |
| Saco | 1.81 ft | within the normal range for the date | -0.01 ft |
| Tarkio River | |||
| Fairfax | 6.72 ft | within the normal range for the date | -0.02 ft |
| Tavern Creek | |||
| St. Elizabeth | 0.51 ft | in the lowest 10 percent for the date | 0 ft |
| Thompson River (IA/MO) | |||
| Trenton | 11.69 ft | within the normal range for the date | -0.05 ft |
| Turkey Creek | |||
| Hollister | 2.74 ft | -0.02 ft | |
| Turnback Creek | |||
| Greenfield | 4.27 ft | lower than any day of these dates in 29 years | 0 ft |
| Wakenda Creek | |||
| Carrollton | 2.45 ft | lower than any day of these dates in 17 years | +0.01 ft |
| Weaubleau Creek | |||
| Weableau | 1.28 ft | in the lowest 10 percent for the date | +0.01 ft |
| White River | |||
| School of the Ozarks | 700.98 ft | within the normal range for the date | +0.15 ft |
| Table Rock Lake | 909.44 ft | -0.08 ft | |
| Wilson Creek | |||
| Brookline | 2.36 ft | within the normal range for the date | +0.05 ft |
| Springfield | 2.50 ft | within the normal range for the date | +0.08 ft |
| Springfield (near) | 0.39 ft | in the lowest 5 percent for the date | 0 ft |
Keep exploring
 Country, United States Are the rivers and lakes in the United States unusually low or high? Every river and lake we follow here, against normal for the date.
 Today's list, United States Which places in the United States are furthest from normal today? The places in the United States furthest below and above normal today.
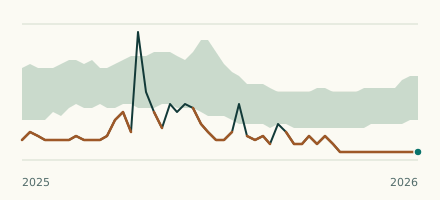 River gauge, United States Is the Little St. Francis River unusually low at Fredericktown? Level now, history, the same date in past years and each year's range.
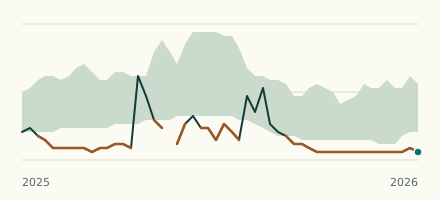 River gauge, United States Is the Little Sugar Creek unusually low at Pineville? Level now, history, the same date in past years and each year's range.