Massachusetts river levels today
Are the rivers and lakes in Massachusetts unusually low or high?
We follow 58 water level gauges in Massachusetts. 1 gauge reads below its normal range for the date and none above it, not counting the 5 tide stations.
How many gauges do we follow in Massachusetts?
58 gauges of the 7,007 we follow in the United States, as of 21 November 2026.
How many waters in Massachusetts have a level gauge?
40 waters with a level gauge, of the 3,733 waters we follow in the United States, as of 21 November 2026.
How many gauges read below normal for the date?
1 gauge below its normal range, of the 4 gauges with a current reading and a normal range for the date, not counting the 5 tide stations, as of 21 November 2026.
How many gauges read above normal for the date?
0 gauges above their normal range, of the 4 gauges with a current reading and a normal range for the date, not counting the 5 tide stations, as of 21 November 2026.
How the places stand today
1 place below normal and 0 places above
Which places are furthest below normal?
Which gauges do we follow in Massachusetts?
| Place | Reading | Against normal for the date | Change in a day |
|---|---|---|---|
| Assabet River | |||
| Maynard | 2.04 ft | +0.01 ft | |
| Blackstone River | |||
| Northbridge | 3.45 ft | within the normal range for the date | +0.05 ft |
| Charles River | |||
| Dover | 1.16 ft | -0.06 ft | |
| Medway | 1.13 ft | -0.02 ft | |
| Waltham | 1.51 ft | -0.03 ft | |
| Chicopee River | |||
| Indian Orchard | 4.63 ft | -0.02 ft | |
| Concord River | |||
| Lowell | 4.74 ft | -0.05 ft | |
| Connecticut River | |||
| Holyoke | 5.77 ft | +1.19 ft | |
| Holyoke - Upper | 3.06 ft | ||
| Montague | 7.09 ft | +0.59 ft | |
| Northampton | 102.84 ft | -0.01 ft | |
| Springfield | 1.10 ft | 0 ft | |
| Deerfield River | |||
| Charlemont | 2.86 ft | +0.69 ft | |
| West Deerfield | 3.05 ft | +0.53 ft | |
| Farmington River | |||
| W. Br. Nr. New Boston | 3.35 ft | -0.01 ft | |
| French River | |||
| Webster | 5.33 ft | 0 ft | |
| Green River | |||
| Colrain | 2.84 ft | -0.01 ft | |
| Hoosic River | |||
| Williamstown | 5.51 ft | -0.02 ft | |
| Housatonic River | |||
| E Br at Coltsville | 0.92 ft | -0.03 ft | |
| Great Barrington | 2.10 ft | in the lowest 5 percent for the date | -0.04 ft |
| Indian Head River | |||
| Hanover | 1.95 ft | -0.05 ft | |
| Ipswich River | |||
| Ipswich | 3.47 ft | -0.07 ft | |
| South Middleton | 2.44 ft | -0.01 ft | |
| Jones River | |||
| Kingston | 3.08 ft | 0 ft | |
| Massachusetts Coast | |||
| Boston | 0.078 m above the tide table | within the normal range for the date | |
| Chatham | 0.043 m above the tide table | within the normal range for the date | |
| Fall River | 0.117 m above the tide table | within the normal range for the date | |
| Nantucket Island | 0.105 m above the tide table | within the normal range for the date | |
| Woods Hole | 0.105 m above the tide table | within the normal range for the date | |
| Merrimack River | |||
| Lawrence | 9.21 ft | within the normal range for the date | +0.37 ft |
| Lowell | 42.36 ft | +0.12 ft | |
| Mill River | |||
| Northampton | 5.88 ft | -0.02 ft | |
| Taunton | 3.94 ft | -0.52 ft | |
| Millers River | |||
| Athol | 6.35 ft | -0.07 ft | |
| Erving | 2.34 ft | -0.03 ft | |
| Monatiquot River | |||
| East Braintree | 1.91 ft | ||
| Muddy River | |||
| Brookline | 7.44 ft | within the normal range for the date | 0 ft |
| Nashua River | |||
| East Pepperell | 1.78 ft | -0.09 ft | |
| Neponset River | |||
| Norwood | 6.03 ft | -0.01 ft | |
| North Nashua River | |||
| Fitchburg | 2.66 ft | -0.03 ft | |
| North River | |||
| Shattuckville | 1.83 ft | -0.05 ft | |
| Old Swamp River | |||
| Weymouth | 2.71 ft | -0.01 ft | |
| Parker River | |||
| Byfield | 0.55 ft | +0.11 ft | |
| Priest Brook | |||
| Winchendon | 2.51 ft | -0.01 ft | |
| Quaboag River | |||
| West Brimfield | 3.05 ft | -0.02 ft | |
| Quashnet River | |||
| Waquoit Village | 2.14 ft | -0.01 ft | |
| Segregansett River | |||
| Dighton | 2.10 ft | -0.01 ft | |
| Shawsheen River | |||
| Andover | 23.97 ft | -0.08 ft | |
| Wilmington | 2.24 ft | -0.05 ft | |
| Squannacook River | |||
| West Groton | 2.09 ft | -0.03 ft | |
| Sudbury River | |||
| Saxonville | 5.92 ft | +0.43 ft | |
| Taunton River | |||
| Bridgewater | 4.25 ft | -0.06 ft | |
| Wading River | |||
| Norton | 5.86 ft | -0.04 ft | |
| Ware River | |||
| Barre Plains | 0.52 ft | -0.01 ft | |
| Gibbs Crossing | 2.47 ft | -0.04 ft | |
| West Branch Westfield River | |||
| Huntington | 3.38 ft | -0.05 ft | |
| West River | |||
| West Hill Dam near Uxbridge | 1.53 ft | 0 ft | |
| Westfield River | |||
| Westfield | 3.54 ft | -0.04 ft | |
Keep exploring
 Country, United States Are the rivers and lakes in the United States unusually low or high? Every river and lake we follow here, against normal for the date.
 Today's list, United States Which places in the United States are furthest from normal today? The places in the United States furthest below and above normal today.
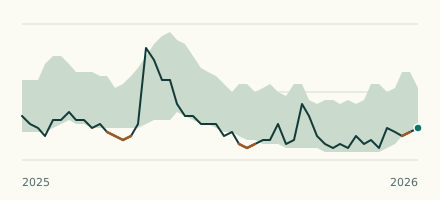 River gauge, United States Is the Housatonic River unusually low at Great Barrington? Level now, history, the same date in past years and each year's range.
 Records, world Which places have set a new record low or high? Record lows and highs in our data, and the newest set.