Illinois river levels today
Are the rivers and lakes in Illinois unusually low or high?
We follow 189 water level gauges in Illinois. 25 gauges read below their normal range for the date and 7 gauges above it.
How many gauges do we follow in Illinois?
189 gauges of the 7,007 we follow in the United States, as of 21 November 2026.
How many waters in Illinois have a level gauge?
77 waters with a level gauge, of the 3,733 waters we follow in the United States, as of 21 November 2026.
How many gauges read below normal for the date?
25 gauges below their normal range, of the 142 gauges with a current reading and a normal range for the date, as of 21 November 2026.
How many gauges read above normal for the date?
7 gauges above their normal range, of the 142 gauges with a current reading and a normal range for the date, as of 21 November 2026.
How the places stand today
25 places below normal and 7 places above
Which places are furthest below normal?
More places
Which places are furthest above normal?
More places
Which gauges do we follow in Illinois?
| Place | Reading | Against normal for the date | Change in a day |
|---|---|---|---|
| Addison Creek | |||
| Bellwood | 1.15 ft | within the normal range for the date | -0.21 ft |
| Aux Sable Creek | |||
| Morris | 2.97 ft | within the normal range for the date | +0.03 ft |
| Big Bureau Creek | |||
| Princeton | 3.02 ft | in the highest 10 percent for the date | -0.01 ft |
| Big Muddy River | |||
| Murphysboro | 3.13 ft | in the lowest 5 percent for the date | +0.02 ft |
| Plumfield | 2.50 ft | in the lowest 5 percent for the date | -0.01 ft |
| Blackberry Creek | |||
| Montgomery | 3.73 ft | within the normal range for the date | +0.10 ft |
| Yorkville | 3.48 ft | within the normal range for the date | +0.03 ft |
| Boone Creek | |||
| Mchenry | 1.01 ft | within the normal range for the date | -0.01 ft |
| Buffalo Creek | |||
| Wheeling | 1.24 ft | within the normal range for the date | +0.01 ft |
| Butterfield Creek | |||
| Flossmoor | 4.09 ft | within the normal range for the date | 0 ft |
| Calumet Union Drainage Canal | |||
| Markham | 2.25 ft | +0.01 ft | |
| Chicago River | |||
| Chicago (Columbus Dr) | -1.96 ft | within the normal range for the date | +0.06 ft |
| Chicago Sanitary and Ship Canal | |||
| Chicago (Western Ave) | -1.96 ft | in the highest 10 percent for the date | -0.05 ft |
| Lockport Lock (tailwater) | 539.04 ft | -0.06 ft | |
| Romeoville | 24.91 ft | ||
| Stickney | -2.03 ft | within the normal range for the date | +0.05 ft |
| Deer Creek | |||
| Chicago Heights | 3.13 ft | in the lowest 5 percent for the date | +0.01 ft |
| Des Plaines River | |||
| Brandon Road Lock (tailwater) | 504.75 ft | -0.07 ft | |
| Des Plaines | 8.01 ft | within the normal range for the date | -0.01 ft |
| Des Plaines (Algonquin Road) | 7.59 ft | -0.01 ft | |
| Gurnee | 1.72 ft | within the normal range for the date | -0.01 ft |
| Joliet | 539.24 ft | in the highest 5 percent for the date | +0.24 ft |
| Lemont | 5.22 ft | in the lowest 10 percent for the date | +0.03 ft |
| Lincolnshire | 6.54 ft | within the normal range for the date | -0.02 ft |
| Lyons | 9.78 ft | in the lowest 10 percent for the date | +0.01 ft |
| River Forest | 3.43 ft | within the normal range for the date | -0.02 ft |
| Riverside | 1.82 ft | in the lowest 10 percent for the date | +0.02 ft |
| Russell | 4.20 ft | in the highest 10 percent for the date | +0.03 ft |
| Du Page River | |||
| Plainfield | 6.81 ft | within the normal range for the date | 0 ft |
| Shorewood | 10.34 ft | in the highest 5 percent for the date | +0.01 ft |
| East Branch Du Page River | |||
| Bolingbrook | 14.69 ft | within the normal range for the date | -0.01 ft |
| Downers Grove | 11.79 ft | in the highest 5 percent for the date | -0.04 ft |
| Lisle | 5.38 ft | 0 ft | |
| Edwards River | |||
| New Boston | 13.27 ft | within the normal range for the date | -0.03 ft |
| Embarras River | |||
| Camargo | 3.87 ft | within the normal range for the date | 0 ft |
| Lawrenceville | 16.51 ft | in the lowest 10 percent for the date | 0 ft |
| Ste Marie | 0.63 ft | within the normal range for the date | +0.01 ft |
| Ferson Creek | |||
| St Charles | 2.14 ft | -0.09 ft | |
| Flag Creek | |||
| Willow Springs | 3.24 ft | within the normal range for the date | -0.01 ft |
| Fox River | |||
| Algonquin | 1.71 ft | within the normal range for the date | +0.03 ft |
| Algonquin tailwater | 5.52 ft | within the normal range for the date | +0.10 ft |
| Antioch | 3.12 ft | within the normal range for the date | +0.03 ft |
| Dayton | 6.15 ft | within the normal range for the date | -0.07 ft |
| Elgin | 709.00 ft | -0.10 ft | |
| Fox Lake | 2.94 ft | within the normal range for the date | -0.06 ft |
| Johnsburg | 2.83 ft | within the normal range for the date | -0.16 ft |
| Lake Villa | 2.98 ft | within the normal range for the date | -0.04 ft |
| McHenry (Stratton Lock and Dam) tailwater | 1.34 ft | within the normal range for the date | +0.09 ft |
| Montgomery | 11.40 ft | within the normal range for the date | +0.04 ft |
| South Elgin Dam | 12.46 ft | within the normal range for the date | +0.03 ft |
| Yorkville (Palmer Dam) | 12.72 ft | within the normal range for the date | +0.01 ft |
| Green River | |||
| Geneseo | 3.96 ft | within the normal range for the date | -0.07 ft |
| Henderson Creek | |||
| Oquawka | 14.59 ft | within the normal range for the date | -0.04 ft |
| Hickory Creek | |||
| Joliet | 10.75 ft | within the normal range for the date | 0 ft |
| Illinois River | |||
| Beardstown | 9.47 ft | +0.05 ft | |
| Dresden Lock (tailwater) | 483.74 ft | +0.29 ft | |
| Hardin | 19.77 ft | +0.12 ft | |
| Havana | 5.71 ft | -0.07 ft | |
| Henry | 14.72 ft | within the normal range for the date | +0.10 ft |
| La Salle | 11.33 ft | +0.18 ft | |
| LaGrange Lock and Dam | 7.63 ft | -1.27 ft | |
| Marseilles | 11.33 ft | within the normal range for the date | +0.09 ft |
| Marseilles Lock (tailwater) | 459.10 ft | +0.14 ft | |
| Meredosia | 2.84 ft | within the normal range for the date | -0.12 ft |
| Morris | 4.98 ft | within the normal range for the date | +0.16 ft |
| Ottawa | 458.67 ft | +0.20 ft | |
| Peoria | 11.73 ft | -0.31 ft | |
| Peoria Lock and Dam | 431.24 ft | -0.16 ft | |
| Seneca | 20.31 ft | within the normal range for the date | +0.09 ft |
| Starved Rock Lock (tailwater) | 441.31 ft | +0.23 ft | |
| Valley City | 2.43 ft | within the normal range for the date | -0.09 ft |
| Iroquois River | |||
| Chebanse | 2.75 ft | within the normal range for the date | -0.01 ft |
| Iroquois | 5.85 ft | within the normal range for the date | -0.04 ft |
| Kankakee River | |||
| Lorenzo | 504.49 ft | lower than any day of these dates in 13 years | -0.13 ft |
| Momence | 1.86 ft | within the normal range for the date | -0.02 ft |
| Wilmington | 1.35 ft | within the normal range for the date | 0 ft |
| Kaskaskia River | |||
| Carlyle | 5.58 ft | +0.02 ft | |
| Carlyle Dam Tailwater | 5.58 ft | in the lowest 10 percent for the date | +0.02 ft |
| Carlyle Lake Dam (pool) | 444.59 ft | -0.01 ft | |
| Cowden | 2.33 ft | within the normal range for the date | +0.03 ft |
| New Athens | 68.46 ft | in the lowest 10 percent for the date | -0.14 ft |
| Shelbyville | 6.42 ft | within the normal range for the date | 0 ft |
| Vandalia | 2.87 ft | within the normal range for the date | +0.07 ft |
| Kishwaukee River | |||
| Belvidere | 1.57 ft | within the normal range for the date | -0.02 ft |
| Marengo | 7.43 ft | within the normal range for the date | -0.06 ft |
| Perryville | 6.02 ft | within the normal range for the date | -0.03 ft |
| Kress Creek | |||
| West Chicago | 3.88 ft | within the normal range for the date | +0.01 ft |
| La Moine River | |||
| Colmar | 3.92 ft | within the normal range for the date | +0.01 ft |
| Ripley | 5.08 ft | within the normal range for the date | +0.01 ft |
| Lake Michigan | |||
| Calumet Harbor | 176.32 m | within the normal range for the date | +0.04 m |
| Lansing Ditch | |||
| Lansing | 5.16 ft | within the normal range for the date | 0 ft |
| Little Calumet River | |||
| South Holland | 5.41 ft | within the normal range for the date | +0.02 ft |
| Little Wabash River | |||
| Carmi | 2.74 ft | within the normal range for the date | 0 ft |
| Clay City | 3.72 ft | within the normal range for the date | +0.01 ft |
| Effingham | 10.46 ft | within the normal range for the date | +0.01 ft |
| Long Run | |||
| Lemont | 0.89 ft | within the normal range for the date | +0.03 ft |
| Mackinaw River | |||
| Congerville | 1.08 ft | within the normal range for the date | 0 ft |
| Mainstream Deep Tunnel | |||
| McCook Reservoir | -272.61 ft | -0.30 ft | |
| Mazon River | |||
| Coal City | 1.30 ft | within the normal range for the date | +0.02 ft |
| McDonald Creek | |||
| Mount Prospect | 0.72 ft | in the lowest 5 percent for the date | -0.01 ft |
| Middle Fork Vermilion River | |||
| Oakwood | 0.85 ft | within the normal range for the date | +0.01 ft |
| Midlothian Creek | |||
| Oak Forest | 1.52 ft | within the normal range for the date | -0.11 ft |
| Mill Creek | |||
| Batavia | 2.22 ft | within the normal range for the date | +0.02 ft |
| Old Mill Creek | 6.24 ft | within the normal range for the date | +0.01 ft |
| Mississippi River | |||
| Alton | 19.10 ft | +0.50 ft | |
| Chester | 8.85 ft | within the normal range for the date | -0.90 ft |
| Fulton | 5.94 ft | -0.02 ft | |
| Gladstone | 3.85 ft | -0.23 ft | |
| Grafton | 16.09 ft | within the normal range for the date | +0.29 ft |
| Grand Tower | 14.49 ft | -0.66 ft | |
| Illinois City | 5.06 ft | -0.08 ft | |
| Keithsburg | 7.79 ft | -0.23 ft | |
| Mel Price (Alton) Lock and Dam | 5.64 ft | -1.03 ft | |
| Mozier Landing | 35.65 ft | -0.13 ft | |
| New Boston | 6.53 ft | -0.29 ft | |
| Quincy | 11.51 ft | -0.07 ft | |
| Quincy Lock and Dam 21 | 6.57 ft | -0.38 ft | |
| Rock Island | 6.43 ft | +0.11 ft | |
| Thebes | 13.77 ft | within the normal range for the date | -0.54 ft |
| Natalie Creek | |||
| Midlothian | 5.12 ft | in the lowest 10 percent for the date | 0 ft |
| Nippersink Creek | |||
| Spring Grove | 4.30 ft | within the normal range for the date | +0.02 ft |
| Wonder Lake | 4.88 ft | within the normal range for the date | 0 ft |
| North Branch Chicago River | |||
| Chicago (Grand Ave) | -1.89 ft | in the highest 10 percent for the date | +0.05 ft |
| Chicago (Pulaski Rd) | 10.71 ft | -0.02 ft | |
| Deerfield | 4.01 ft | within the normal range for the date | -0.02 ft |
| Niles | 0.74 ft | in the lowest 5 percent for the date | -0.01 ft |
| North Fork Embarras River | |||
| Oblong | 2.12 ft | within the normal range for the date | -0.01 ft |
| North Fork Vermilion River | |||
| Bismarck | 4.86 ft | within the normal range for the date | -0.01 ft |
| Ohio River | |||
| Cairo | 14.10 ft | +0.59 ft | |
| Cairo, IL (Corps) | 14.07 ft | +0.59 ft | |
| Golconda | 30.51 ft | +0.28 ft | |
| Olmsted Lock and Dam Headwater | 22.83 ft | +0.02 ft | |
| Olmsted Lock and Dam Tailwater | 15.64 ft | +0.87 ft | |
| Smithland Lock and Dam | 13.25 ft | +0.26 ft | |
| Pecatonica River | |||
| Freeport | 4.79 ft | within the normal range for the date | -0.02 ft |
| Shirland | 5.22 ft | within the normal range for the date | +0.02 ft |
| Plum Creek | |||
| Crete | 7.67 ft | in the lowest 10 percent for the date | -0.01 ft |
| Pope Creek | |||
| Keithsburg | 19.28 ft | within the normal range for the date | -0.01 ft |
| Poplar Creek | |||
| Elgin | 1.04 ft | in the lowest 10 percent for the date | 0 ft |
| Rock River | |||
| Byron | 6.36 ft | within the normal range for the date | +0.14 ft |
| Como | 4.03 ft | +0.02 ft | |
| Dixon | 8.85 ft | within the normal range for the date | +0.02 ft |
| Joslin | 5.83 ft | within the normal range for the date | -0.05 ft |
| Latham Park | 4.87 ft | within the normal range for the date | +0.28 ft |
| Moline | 8.74 ft | -0.03 ft | |
| Rockford (Auburn Street) | 3.14 ft | within the normal range for the date | +0.16 ft |
| Rockford (Fordam Dam) | 2.67 ft | within the normal range for the date | +0.15 ft |
| Rockton | 4.50 ft | within the normal range for the date | +0.16 ft |
| Salt Creek | |||
| Elk Grove Village | 11.86 ft | in the lowest 5 percent for the date | +0.01 ft |
| Elmhurst | 4.97 ft | in the lowest 5 percent for the date | -0.02 ft |
| Greenview | 1.24 ft | within the normal range for the date | 0 ft |
| Oak Brook | 47.89 ft | within the normal range for the date | 0 ft |
| Rolling Meadows | 2.17 ft | in the lowest 5 percent for the date | +0.02 ft |
| Rowell | 9.19 ft | within the normal range for the date | 0 ft |
| Western Springs | 1.46 ft | in the lowest 5 percent for the date | -0.04 ft |
| Wood Dale | 6.65 ft | within the normal range for the date | +0.08 ft |
| Sangamon River | |||
| Chandlerville | 443.77 ft | -0.02 ft | |
| Monticello | 4.70 ft | within the normal range for the date | 0 ft |
| Oakford | 3.30 ft | within the normal range for the date | -0.01 ft |
| Petersburg | 4.31 ft | within the normal range for the date | -0.01 ft |
| Riverton | 2.18 ft | in the lowest 10 percent for the date | -0.05 ft |
| Sawmill Creek | |||
| Lemont | 8.25 ft | within the normal range for the date | 0 ft |
| Skillet Fork River | |||
| Wayne City | 4.43 ft | in the lowest 5 percent for the date | +0.02 ft |
| Skokie River | |||
| Highland Park | 3.24 ft | within the normal range for the date | -0.01 ft |
| Lake Forest | 2.09 ft | within the normal range for the date | +0.02 ft |
| South Branch Kishwaukee River | |||
| De Kalb | 3.47 ft | within the normal range for the date | -0.01 ft |
| Fairdale | 2.29 ft | within the normal range for the date | -0.03 ft |
| Spoon River (W-IL) | |||
| London Mills | 3.53 ft | within the normal range for the date | +0.01 ft |
| Seville | 7.00 ft | within the normal range for the date | +0.05 ft |
| Spring Brook | |||
| Naperville (87th Street) | 2.87 ft | within the normal range for the date | -0.03 ft |
| St. Joseph Creek | |||
| Lisle | 4.20 ft | within the normal range for the date | -0.02 ft |
| Stony Creek | |||
| Worth | 25.38 ft | -0.04 ft | |
| Sugar Creek (Central IL) | |||
| Bloomington | 0.83 ft | in the lowest 10 percent for the date | 0 ft |
| Sugar Creek (E-IL) | |||
| Milford | 2.78 ft | in the lowest 5 percent for the date | -0.02 ft |
| Thorn Creek | |||
| Glenwood | 2.50 ft | lower than any day of these dates in 32 years | +0.02 ft |
| Thornton | 2.82 ft | within the normal range for the date | +0.01 ft |
| Tinley Creek | |||
| Palos Park | 2.68 ft | within the normal range for the date | +0.14 ft |
| Tyler Creek | |||
| Elgin | 5.66 ft | within the normal range for the date | -0.01 ft |
| Vermilion River | |||
| Pontiac | 2.77 ft | within the normal range for the date | 0 ft |
| Vermilion River (E-IL) | |||
| Danville | 2.40 ft | within the normal range for the date | -0.04 ft |
| Vermilion River (N-IL) | |||
| Leonore | 3.37 ft | within the normal range for the date | 0 ft |
| Wabash River | |||
| Mount Carmel | 3.98 ft | -0.01 ft | |
| Waubonse Creek | |||
| Oswego | 8.67 ft | within the normal range for the date | +0.03 ft |
| Weller Creek | |||
| Des Plaines | 0.74 ft | within the normal range for the date | +0.03 ft |
| West Branch Du Page River | |||
| Naperville | 4.11 ft | in the lowest 10 percent for the date | 0 ft |
| Warrenville | 7.59 ft | within the normal range for the date | -0.01 ft |
| West Chicago | 3.77 ft | within the normal range for the date | -0.03 ft |
| West Fork North Branch Chicago River | |||
| Deerfield | 7.35 ft | +0.06 ft | |
| Northbrook | 0.93 ft | within the normal range for the date | -0.01 ft |
Keep exploring
 Country, United States Are the rivers and lakes in the United States unusually low or high? Every river and lake we follow here, against normal for the date.
 Today's list, United States Which places in the United States are furthest from normal today? The places in the United States furthest below and above normal today.
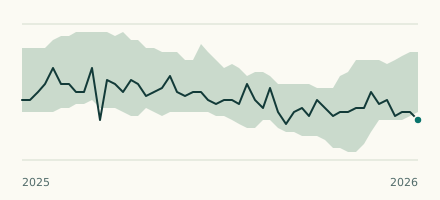 River gauge, United States Is the Kankakee River unusually low at Lorenzo? Level now, history, the same date in past years and each year's range.
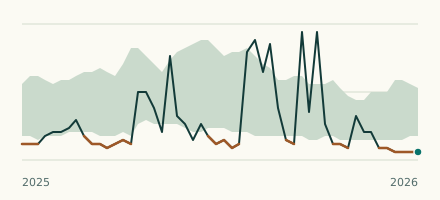 River gauge, United States Is the Thorn Creek unusually low at Glenwood? Level now, history, the same date in past years and each year's range.