Florida river levels today
Are the rivers and lakes in Florida unusually low or high?
We follow 101 water level gauges in Florida. 4 gauges read below their normal range for the date and 25 gauges above it, not counting the 20 tide stations.
How many gauges do we follow in Florida?
101 gauges of the 7,007 we follow in the United States, as of 21 November 2026.
How many waters in Florida have a level gauge?
56 waters with a level gauge, of the 3,733 waters we follow in the United States, as of 21 November 2026.
How many gauges read below normal for the date?
4 gauges below their normal range, of the 61 gauges with a current reading and a normal range for the date, not counting the 20 tide stations, as of 21 November 2026.
How many gauges read above normal for the date?
25 gauges above their normal range, of the 61 gauges with a current reading and a normal range for the date, not counting the 20 tide stations, as of 21 November 2026.
How the places stand today
4 places below normal and 25 places above
Which places are furthest below normal?
Which places are furthest above normal?
More places
Which gauges do we follow in Florida?
| Place | Reading | Against normal for the date | Change in a day |
|---|---|---|---|
| Alafia River | |||
| Lithia Pinecrest Road at Lithia | 5.44 ft | in the highest 10 percent for the date | -0.15 ft |
| US 301 Riverview | 0.91 ft | in the lowest 5 percent for the date | +0.20 ft |
| Alligator Creek | |||
| Garfield Bight | 0.17 ft | ||
| Anclote River | |||
| Elfers at Little Road | 10.02 ft | in the highest 10 percent for the date | +0.07 ft |
| Apalachicola River | |||
| Blountstown | 1.48 ft | -0.18 ft | |
| Chattahoochee | 38.70 ft | within the normal range for the date | -0.08 ft |
| Wewahitchka at Mile 44 (USACE) | 11.96 ft | ||
| Aucilla River | |||
| Lamont (US 27) | 46.20 ft | within the normal range for the date | +0.10 ft |
| Bear Creek | |||
| US 231 | 14.98 ft | +0.04 ft | |
| Big Coldwater Creek | |||
| Milton | 2.23 ft | within the normal range for the date | 0 ft |
| Big Slough Canal | |||
| Myakka City | 26.03 ft | -0.06 ft | |
| Black Creek | |||
| Middleburg | 14.35 ft | higher than any day of these dates in 45 years | +1.02 ft |
| Blackwater River | |||
| Baker | 1.05 ft | in the lowest 5 percent for the date | -0.01 ft |
| Bruce Creek | |||
| Redbay | 10.82 ft | within the normal range for the date | +0.09 ft |
| Caloosahatchee River | |||
| Fort Myers | 0.319 m above the tide table | in the highest 5 percent for the date | |
| Central Drainage Ditch | |||
| Orange Avenue | 30.69 ft | +0.17 ft | |
| Chipola River | |||
| Altha (CR 274) | 8.94 ft | within the normal range for the date | -0.01 ft |
| Marianna (US 90) | 5.44 ft | within the normal range for the date | 0 ft |
| Scott's Ferry | 15.48 ft | +0.02 ft | |
| Wewahitchka (Lands Landing) | 10.15 ft | -0.07 ft | |
| Choctawhatchee River | |||
| Bruce-Ebro (SR 20) | 6.17 ft | within the normal range for the date | -0.03 ft |
| Caryville (US 90) | 2.46 ft | within the normal range for the date | -0.02 ft |
| Pittman (SR 2) | 7.58 ft | within the normal range for the date | +0.02 ft |
| Crooked River | |||
| CR 67 above Carrabelle | 0.81 ft | -0.29 ft | |
| Cypress Creek | |||
| SR 54 Worthington Gardens | 4.55 ft | within the normal range for the date | +0.04 ft |
| East Side Creek | |||
| Lake Ingraham | 0.78 ft | +0.12 ft | |
| Econfina Creek | |||
| Bennett | 6.61 ft | within the normal range for the date | -0.05 ft |
| Econfina River | |||
| Perry (CR 655) | 2.93 ft | within the normal range for the date | +0.06 ft |
| Escambia River | |||
| Century | 3.38 ft | +0.24 ft | |
| Fenholloway River | |||
| Foley | 11.32 ft | in the highest 10 percent for the date | +0.92 ft |
| Foley (US 27) | 4.60 ft | in the highest 5 percent for the date | +1.39 ft |
| Fisheating Creek | |||
| Lakeport at Highway 78 | 14.98 ft | within the normal range for the date | +0.09 ft |
| Palmdale | 4.85 ft | within the normal range for the date | -0.06 ft |
| Florida Coast | |||
| Apalachicola | 0.138 m above the tide table | within the normal range for the date | |
| Cedar Key | 0.057 m above the tide table | within the normal range for the date | |
| Clearwater Beach | 0.274 m above the tide table | within the normal range for the date | |
| Fernandina Beach | 0.462 m above the tide table | in the highest 5 percent for the date | |
| Key West | 0.22 m above the tide table | within the normal range for the date | |
| Lake Worth Pier | 0.236 m above the tide table | within the normal range for the date | |
| Mayport (Bar Pilots Dock) | 0.435 m above the tide table | in the highest 5 percent for the date | |
| Old Port Tampa | 0.286 m above the tide table | within the normal range for the date | |
| Panama City | 0.218 m above the tide table | within the normal range for the date | |
| Panama City Beach | 0.223 m above the tide table | within the normal range for the date | |
| Pensacola | 0.299 m above the tide table | in the highest 10 percent for the date | |
| Port Manatee | 0.288 m above the tide table | in the highest 10 percent for the date | |
| St. Petersburg | 0.277 m above the tide table | within the normal range for the date | |
| Trident Pier, Port Canaveral | 0.323 m above the tide table | in the highest 10 percent for the date | |
| Vaca Key | 0.24 m above the tide table | within the normal range for the date | |
| Virginia Key | 0.205 m above the tide table | within the normal range for the date | |
| Hillsborough River | |||
| Fowler Avenue | 21.91 ft | within the normal range for the date | +0.07 ft |
| Morris Bridge | 26.41 ft | within the normal range for the date | +0.06 ft |
| Zephyrhills at State Park | 2.14 ft | in the highest 10 percent for the date | 0 ft |
| Holmes Creek | |||
| Vernon (SR 79) | 11.36 ft | within the normal range for the date | +0.01 ft |
| Horse Creek | |||
| Arcadia at SR 72 | 6.02 ft | in the highest 10 percent for the date | -0.11 ft |
| Imperial River | |||
| Bonita Springs | 3.70 ft | within the normal range for the date | -0.04 ft |
| Inundation Sensor | |||
| Fort Myers 1st Street | 0.00 ft | 0 ft | |
| St. James City | 0.00 ft | 0 ft | |
| Joshua Creek | |||
| Nocatee | 5.98 ft | -0.06 ft | |
| Lake Iamonia | |||
| Waterfront Drive | 93.03 ft | -0.01 ft | |
| Lake Kanturk | |||
| Clifden Drive (in NAVD88 | 68.87 ft | -0.03 ft | |
| Little Manatee River | |||
| Wimauma at US 301 | 4.80 ft | in the highest 10 percent for the date | -0.10 ft |
| Little River | |||
| Quincy | 1.73 ft | within the normal range for the date | -0.14 ft |
| Little River (Midway) | |||
| Midway (SR 268) | 68.74 ft | within the normal range for the date | -0.03 ft |
| Little Wekiva River | |||
| Altamonte Springs 2N | 27.66 ft | in the highest 5 percent for the date | +0.17 ft |
| Manatee River | |||
| Manatee Dam | 39.52 ft | +0.02 ft | |
| Myakka Head at SR 64 | 4.33 ft | in the highest 10 percent for the date | -0.02 ft |
| Rye Bridge | 1.06 ft | in the lowest 5 percent for the date | +0.23 ft |
| Munson Slough | |||
| Oak Ridge Road | 10.05 ft | -0.02 ft | |
| Myakka River | |||
| Myakka River State Park | 5.04 ft | within the normal range for the date | -0.14 ft |
| North Fork Black Creek | |||
| Middleburg | 7.28 ft | in the highest 5 percent for the date | +5.01 ft |
| Ochlockonee River | |||
| Bloxham (SR 20) | 4.29 ft | within the normal range for the date | -0.04 ft |
| Concord (CR 12) | 24.15 ft | within the normal range for the date | +0.02 ft |
| Havana (US 27) | 12.76 ft | within the normal range for the date | +0.03 ft |
| Ocklawaha River | |||
| Conner | 5.03 ft | within the normal range for the date | +0.79 ft |
| Eureka | 20.79 ft | within the normal range for the date | +0.43 ft |
| Moss Bluff Dam | 37.53 ft | within the normal range for the date | +1.19 ft |
| Ocala | 36.85 ft | in the highest 5 percent for the date | +1.18 ft |
| Orange Creek | |||
| Orange Springs | 5.27 ft | in the highest 10 percent for the date | +2.20 ft |
| Peace River | |||
| Fort Meade | 76.06 ft | in the highest 5 percent for the date | +0.15 ft |
| SR 60 Bartow | 6.70 ft | in the highest 10 percent for the date | -0.05 ft |
| SR 70 Arcadia | 5.98 ft | in the highest 10 percent for the date | -0.19 ft |
| Zolfo Springs | 9.29 ft | in the highest 10 percent for the date | +0.02 ft |
| Perdido River | |||
| Barrineau Park | 1.43 ft | within the normal range for the date | -0.01 ft |
| Shingle Creek | |||
| Campbell | 56.04 ft | in the highest 5 percent for the date | +0.17 ft |
| Shoal River | |||
| Crestview | 4.65 ft | within the normal range for the date | 0 ft |
| Mossy Head (CR 1087) | 6.83 ft | within the normal range for the date | -0.02 ft |
| Sopchoppy River | |||
| Sopchoppy (FR 343) | 8.63 ft | within the normal range for the date | +0.07 ft |
| South Fork Black Creek | |||
| Penney Farms | 7.98 ft | in the highest 5 percent for the date | +5.81 ft |
| St. Johns River | |||
| Astor | 3.99 ft | higher than any day of these dates in 35 years | +0.40 ft |
| Cocoa | 18.76 ft | higher than any day of these dates in 73 years | +0.12 ft |
| Dames Point | 0.434 m above the tide table | in the highest 5 percent for the date | |
| Deland | 5.02 ft | in the highest 5 percent for the date | +0.40 ft |
| I-295 Buckman Bridge | 0.45 m above the tide table | higher than any day of these dates in 10 years | |
| Lake Harney | 12.05 ft | higher than any day of these dates in 84 years | +1.31 ft |
| Sanford | 6.91 ft | higher than any day of these dates in 33 years | +0.54 ft |
| Southbank Riverwalk | 0.364 m above the tide table | in the highest 5 percent for the date | |
| St. Marks River | |||
| Newport on Old Magnolia Rd (in stage datum) | 6.44 ft | in the highest 5 percent for the date | +0.02 ft |
| St. Marys River | |||
| Macclenny | 3.51 ft | ||
| Moniac | 5.76 ft | within the normal range for the date | +0.87 ft |
| Steinhatchee River | |||
| Cross City | 2.42 ft | ||
| Yellow River | |||
| Milligan | 1.06 ft | in the lowest 10 percent for the date | -0.02 ft |
Keep exploring
 Country, United States Are the rivers and lakes in the United States unusually low or high? Every river and lake we follow here, against normal for the date.
 Today's list, United States Which places in the United States are furthest from normal today? The places in the United States furthest below and above normal today.
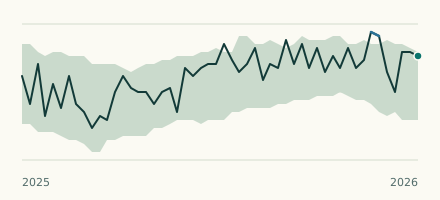 River gauge, United States Is the Alafia River unusually low at US 301 Riverview? Level now, history, the same date in past years and each year's range.
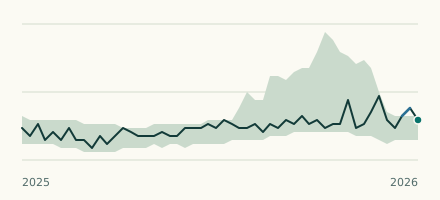 River gauge, United States Is the Manatee River unusually low at Rye Bridge? Level now, history, the same date in past years and each year's range.