London catchment river levels today
Are the rivers and lakes in the London catchment unusually low or high?
We follow 46 water level gauges in the London catchment. 9 gauges read below their normal range for the date and 2 gauges above it.
How many gauges do we follow in the London catchment?
46 gauges of the 2,378 we follow in the United Kingdom, as of 21 November 2026.
How many waters in the London catchment have a level gauge?
14 waters with a level gauge, of the 1,152 waters we follow in the United Kingdom, as of 21 November 2026.
How many gauges read below normal for the date?
9 gauges below their normal range, of the 26 gauges with a current reading and a normal range for the date, as of 21 November 2026.
How many gauges read above normal for the date?
2 gauges above their normal range, of the 26 gauges with a current reading and a normal range for the date, as of 21 November 2026.
How the places stand today
9 places below normal and 2 places above
Which places are furthest below normal?
More places
Which places are furthest above normal?
Which gauges do we follow in London?
| Place | Reading | Against normal for the date | Change in a day |
|---|---|---|---|
| Beverley Brook | |||
| Barnes | 1.464 m | in the highest 5 percent for the date | -0.013 m |
| Motspur Park | 0.895 m | within the normal range for the date | +0.008 m |
| New Malden | 0.722 m | -0.026 m | |
| Wimbledon Common | 0.18 m | in the lowest 5 percent for the date | -0.024 m |
| Worcester Park | 1.014 m | within the normal range for the date | -0.007 m |
| Hogsmill River | |||
| Ewell | 0.088 m | within the normal range for the date | -0.001 m |
| Kingston Hogsmill | 0.137 m | -0.035 m | |
| Worcester Road | 1.145 m | -0.023 m | |
| Kyd Brook | |||
| Gosshill Road | 0.513 m | within the normal range for the date | 0 m |
| Hazelmere Road | 0.581 m | within the normal range for the date | -0.005 m |
| Kydbrook Close | 0.402 m | lower than any day of these dates in 24 years | -0.008 m |
| Lower Camden | 0.909 m | within the normal range for the date | -0.011 m |
| Woodlands Road | 1.191 m | in the highest 10 percent for the date | -0.014 m |
| Norbury Brook | |||
| Thornton Heath | 0.961 m | in the lowest 5 percent for the date | -0.011 m |
| Pyl Brook | |||
| Kings College | 0.365 m | -0.011 m | |
| Morden Park | 0.462 m | in the lowest 10 percent for the date | -0.005 m |
| North Cheam | 1.048 m | -0.013 m | |
| River Graveney | |||
| Abercairn Road | 0.925 m | -0.008 m | |
| Longley Road | 0.077 m | within the normal range for the date | -0.008 m |
| River Pool | |||
| Winsford Road | 0.07 m | in the lowest 5 percent for the date | -0.012 m |
| River Quaggy | |||
| Chinbrook Park | 0.046 m | within the normal range for the date | -0.022 m |
| Manor House Gardens | 0.043 m | within the normal range for the date | -0.013 m |
| River Ravensbourne | |||
| Beckenham Park | 0.511 m | within the normal range for the date | -0.004 m |
| Bishops Avenue | 0.537 m | -0.001 m | |
| Bromley | 0.053 m | within the normal range for the date | -0.006 m |
| Bromley South | 0.057 m | within the normal range for the date | -0.004 m |
| Catford Hill | 0.073 m | in the lowest 5 percent for the date | -0.015 m |
| Hayes Lane | 0.045 m | +0.013 m | |
| Magpie Hall Lane | 0.957 m | -0.007 m | |
| River Thames | |||
| Charlton | 2.984 m | +0.376 m | |
| Richmond | 2.496 m | -1.227 m | |
| Silvertown | 2.975 m | +0.413 m | |
| Southend | 2.035 m | +0.71 m | |
| Tilbury | 2.623 m | +0.686 m | |
| Tower Pier | 2.939 m | +0.036 m | |
| Westminster | 2.991 m | -0.12 m | |
| River Wandle | |||
| Beddington Park | 0.25 m | within the normal range for the date | 0 m |
| Carshalton Ponds | 0.067 m | within the normal range for the date | 0 m |
| Hackbridge | 1.124 m | in the lowest 5 percent for the date | +0.005 m |
| Summerstown | 0.869 m | -0.026 m | |
| Waddon Ponds | 0.01 m | lower than any day of these dates in 12 years | +0.014 m |
| Wandle Park Main Channel | 0.193 m | lower than any day of these dates in 40 years | -0.025 m |
| Wandle Park Side Channel | 0.234 m | -0.03 m | |
| Spring Brook | |||
| Downham Lane | -27.655 m | -0.001 m | |
| St James Stream | |||
| Upper Elmers End | 0.425 m | -0.028 m | |
| The Beck | |||
| Beckenham | 0.47 m | within the normal range for the date | -0.009 m |
Keep exploring
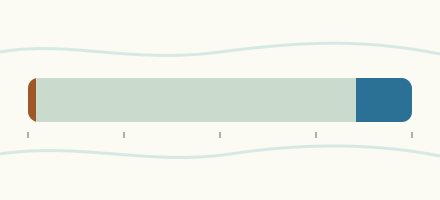 Country, United Kingdom Are the rivers and lakes in the United Kingdom unusually low or high? Every river and lake we follow here, against normal for the date.
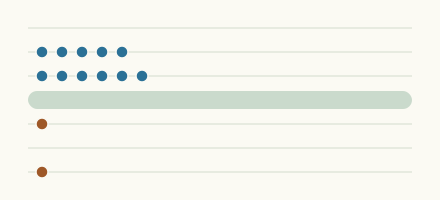 Today's list, United Kingdom Which places in the United Kingdom are furthest from normal today? The places in the United Kingdom furthest below and above normal today.
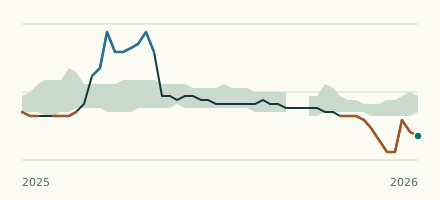 River gauge, United Kingdom Is the River Wandle unusually low at Waddon Ponds? Level now, history, the same date in past years and each year's range.
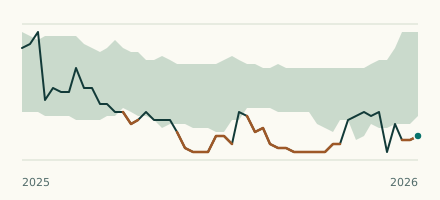 River gauge, United Kingdom Is the Kyd Brook unusually low at Kydbrook Close? Level now, history, the same date in past years and each year's range.