Wurm water level at Randerath today
How high is the Wurm at Randerath today?
The Wurm at Randerath read 141 cm at .
Level now
141 cm
Provisional
Where the water stands
That is below the first flood information level of 230 cm set by the state office LANUK.
Table: where the water stands
| Level | Value |
|---|---|
| Newest reading | 141 cm, |
| Mean low water level | 69 cm |
| Mean water level | 86 cm |
| Mean high water level | 255 cm |
| First flood information level | 230 cm |
| Second flood information level | 250 cm |
| Third flood information level | 275 cm |
| Highest in our series | 224.7 cm |
| Lowest in our series | 65.3 cm |
- Past day
- -11.8 cm
- Past week
- +66.6 cm
The gauge reads the height of the water above a fixed zero, not the depth of the river.
The last 12 months, week by week
- Level
- Our record
Table: The last 12 months, week by week
| Week starting | Weekly average (cm) |
|---|---|
| 84.6 cm | |
| 78.9 cm | |
| 77.9 cm | |
| 87.7 cm | |
| 74.1 cm | |
| 71.0 cm | |
| 73.3 cm | |
| 88.7 cm | |
| 92.0 cm | |
| 75.9 cm | |
| 78.5 cm | |
| 84.6 cm | |
| 98.4 cm | |
| 125.6 cm | |
| 103.0 cm | |
| 79.5 cm | |
| 95.4 cm | |
| 84.9 cm | |
| 86.7 cm | |
| 86.1 cm | |
| 78.1 cm | |
| 81.8 cm | |
| 76.3 cm | |
| 78.1 cm | |
| 88.3 cm | |
| 93.9 cm | |
| 82.3 cm | |
| 74.4 cm | |
| 90.3 cm | |
| 85.5 cm | |
| 79.1 cm | |
| 73.2 cm | |
| 70.0 cm | |
| 68.4 cm | |
| 67.7 cm | |
| 67.7 cm | |
| 68.3 cm | |
| 71.7 cm | |
| 65.9 cm | |
| 93.5 cm | |
| 70.7 cm | |
| 81.5 cm | |
| 76.6 cm | |
| 79.0 cm | |
| 68.8 cm | |
| 69.2 cm | |
| 92.1 cm | |
| 73.1 cm | |
| 90.5 cm | |
| 77.6 cm | |
| 69.7 cm | |
| 81.6 cm | |
| 133.3 cm |
Official levels
- First flood information level: 230 cm. The newest reading is 89 cm below it.Published by Landesamt für Natur, Umwelt und Klima Nordrhein-Westfalen (LANUK).
- Second flood information level: 250 cm. The newest reading is 109 cm below it.Published by Landesamt für Natur, Umwelt und Klima Nordrhein-Westfalen (LANUK).
- Third flood information level: 275 cm. The newest reading is 134 cm below it.Published by Landesamt für Natur, Umwelt und Klima Nordrhein-Westfalen (LANUK).
- Mean low water level: 69 cm. The newest reading is 72 cm above it.Published by Landesamt für Natur, Umwelt und Klima Nordrhein-Westfalen (LANUK).
- Mean water level: 86 cm. The newest reading is 55 cm above it.Published by Landesamt für Natur, Umwelt und Klima Nordrhein-Westfalen (LANUK).
- Mean high water level: 255 cm. The newest reading is 114 cm below it.Published by Landesamt für Natur, Umwelt und Klima Nordrhein-Westfalen (LANUK).
Records
- Highest daily average in our series since 20 November 2024: 224.7 cm on 9 September 2025. Provisional data.
- Lowest daily average in our series since 20 November 2024: 65.3 cm on 9 August 2026. Provisional data.
Also on this water
About this gauge
Randerath is a gauge on the Wurm in Germany.
It lies at 51.0150° N, 6.1792° E.
Its readings come from the state office for nature, environment and climate of North Rhine-Westphalia (LANUK).
Readings since 20 November 2024: too short a record for a normal range for the date or for records that mean much.
LANUK publishes its newest readings as unchecked raw data in files it rebuilds once a day; the normal range and the records on this page come from its checked daily series, which it releases months later, and from its raw daily means for the days it has no checked value for yet.
The newest reading is provisional: the source may still correct it.
Keep exploring
 Catchment, Germany Are the rivers and lakes in the Rur catchment unusually low or high? Every river and lake we follow here, against normal for the date.
 Country, Germany Are the rivers and lakes in Germany unusually low or high? Every river and lake we follow in Germany, against normal for the date.
 Today's list, Germany Which places in Germany are furthest from normal today? The places in Germany furthest below and above normal today.
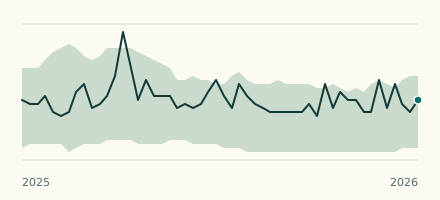 River gauge, Germany Is the Wurm unusually high at Herzogenrath (first gauge)? Level now, history, the same date in past years and each year's range.