Rur catchment river levels today
Are the rivers and lakes in the Rur catchment unusually low or high?
We follow 27 water level gauges in the Rur catchment. None read below their normal range for the date and 17 gauges above it.
How many gauges do we follow in the Rur catchment?
27 gauges of the 1,158 we follow in Germany, as of 21 November 2026.
How many waters in the Rur catchment have a level gauge?
14 waters with a level gauge, of the 363 waters we follow in Germany, as of 21 November 2026.
How many gauges read below normal for the date?
0 gauges below their normal range, of the 24 gauges with a current reading and a normal range for the date, as of 21 November 2026.
How many gauges read above normal for the date?
17 gauges above their normal range, of the 24 gauges with a current reading and a normal range for the date, as of 21 November 2026.
How the places stand today
0 places below normal and 17 places above
Which places are furthest above normal?
More places
Which gauges do we follow in Rur catchment?
| Place | Reading | Against normal for the date | Change in a day |
|---|---|---|---|
| Beeckfließ | |||
| Honsdorf | 44.3 cm | in the highest 5 percent for the date | -9.4 cm |
| Broicher Bach | |||
| Herzogenrath (second gauge) | 63 cm | in the highest 5 percent for the date | -11.1 cm |
| Haarbach | |||
| Haaren | 28.9 cm | in the highest 5 percent for the date | -1.3 cm |
| Inde | |||
| Eschweiler | 108.9 cm | in the highest 5 percent for the date | +43.1 cm |
| Kirchberg (first gauge) | 164.9 cm | higher than any day of these dates in 20 years | +22.1 cm |
| Kornelimünster | 80.8 cm | in the highest 5 percent for the date | +24.7 cm |
| Lamersdorf | 150.6 cm | higher than any day of these dates in 19 years | +44.1 cm |
| Merzbach | |||
| Welz | 26.4 cm | within the normal range for the date | +1.9 cm |
| Olef | |||
| Schleiden | 186.2 cm | within the normal range for the date | +11.4 cm |
| Platißbach | |||
| Hellenthal | 74.6 cm | in the highest 10 percent for the date | +1.8 cm |
| Rodebach | |||
| Süsterseel | 28.8 cm | within the normal range for the date | -9 cm |
| Rur | |||
| Altenburg | 39.9 cm | within the normal range for the date | +28.1 cm |
| Jülich Stadion | 193.1 cm | +39.1 cm | |
| Linnich | 142.5 cm | +19 cm | |
| Monschau | 89.8 cm | in the highest 5 percent for the date | +11.8 cm |
| Selhausen | 104.6 cm | within the normal range for the date | +31.9 cm |
| Stah | 131 cm | in the highest 10 percent for the date | +21 cm |
| Zerkall | 98.3 cm | in the highest 10 percent for the date | +20 cm |
| Urft | |||
| Gemünd | 149 cm | in the highest 5 percent for the date | +29 cm |
| Kall-Sportplatz | 99.5 cm | in the highest 5 percent for the date | +26.4 cm |
| Vichtbach | |||
| Mulartshütte | 64.9 cm | in the highest 5 percent for the date | +8.7 cm |
| Roetgen | 55.3 cm | in the highest 5 percent for the date | +6.4 cm |
| Wehebach | |||
| Luchem | 32 cm | within the normal range for the date | -1.1 cm |
| Weidenbach | |||
| Rurberg | 42.8 cm | within the normal range for the date | +11.7 cm |
| Wurm | |||
| Herzogenrath (first gauge) | 101.3 cm | in the highest 5 percent for the date | -14.2 cm |
| Kalkofen | 29.6 cm | in the highest 5 percent for the date | -8.5 cm |
| Randerath | 141 cm | -11.8 cm | |
Keep exploring
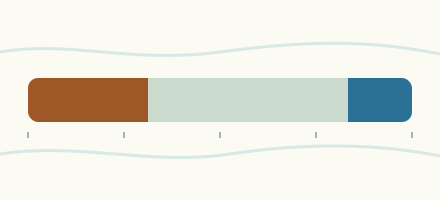 Country, Germany Are the rivers and lakes in Germany unusually low or high? Every river and lake we follow in Germany, against normal for the date.
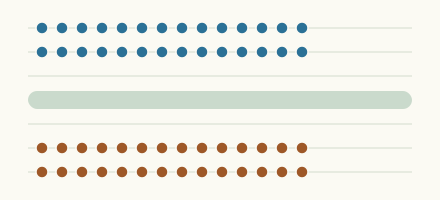 Today's list, Germany Which places in Germany are furthest from normal today? The places in Germany furthest below and above normal today.
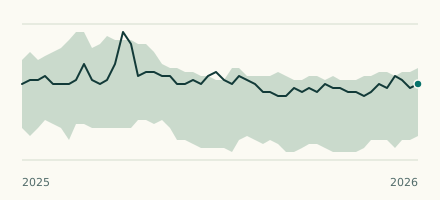 River gauge, Germany Is the Inde unusually high at Lamersdorf? Level now, history, the same date in past years and each year's range.
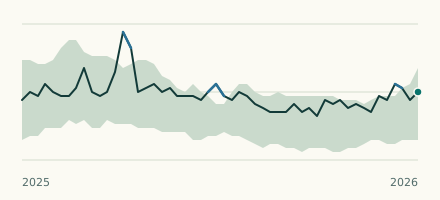 River gauge, Germany Is the Inde unusually high at Kirchberg (first gauge)? Level now, history, the same date in past years and each year's range.