Three Mile Creek Downstream of Yarrawonga Road at Wangaratta
Is the Three Mile Creek Downstream of Yarrawonga Road at Wangaratta within its normal range for the date?
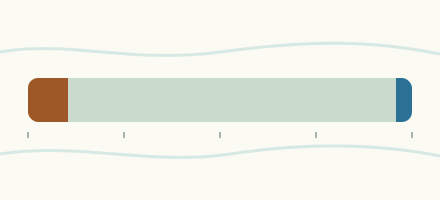
The Three Mile Creek Downstream of Yarrawonga Road at Wangaratta stood at 0.638 m on .
Last reading
within the normal range for the date0.638 m
within the normal range for the date
Table: where the water stands
| Level | Value |
|---|---|
| Newest reading | 0.638 m, |
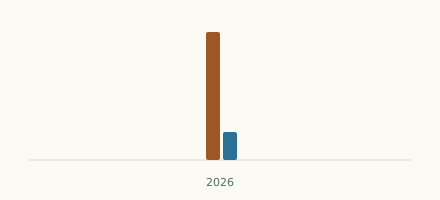
| Normal range for the date | 0.45 m to 1.17 m |
| Median for the date | 0.67 m |
The gauge reads the height of the water above the gauge's own zero, not the depth of the river.
The last 12 months, week by week
- Level
- Our record
Table: The last 12 months, week by week
| Week starting | Weekly average (m) |
|---|---|
| 0.573 m | |
| 0.601 m | |
| 0.531 m | |
| 0.516 m | |
| 0.513 m | |
| 0.546 m | |
| 0.503 m | |
| 0.461 m | |
| 0.556 m | |
| 0.461 m | |
| 0.381 m | |
| no value | |
| no value | |
| no value | |
| no value | |
| no value | |
| no value | |
| 0.494 m | |
| 0.513 m | |
| no value | |
| 0.414 m | |
| 0.439 m | |
| 0.363 m | |
| 0.448 m | |
| 0.366 m | |
| no value | |
| no value | |
| 0.440 m | |
| no value | |
| 0.365 m | |
| 0.361 m | |
| 0.801 m | |
| 0.656 m | |
| 0.740 m | |
| 0.829 m | |
| no value | |
| no value | |
| no value | |
| 1.128 m | |
| 0.965 m | |
| 0.858 m | |
| no value | |
| no value | |
| no value | |
| 1.629 m | |
| 1.684 m | |
| 1.060 m | |
| 0.851 m | |
| 1.009 m | |
| 0.825 m | |
| 0.690 m | |
| 0.648 m | |
| 0.647 m |
How it compares
That is within the normal range for the date.
Records
- Highest daily value in our series since 3 June 2000: 3.275 m on 9 December 2010. Provisional data.
- Lowest daily value in our series since 3 June 2000: 0.044 m on 9 February 2007.
About this gauge
Wangaratta is a gauge on the Three Mile Creek Downstream of Yarrawonga Road in Australia.
It lies at 36.3366° S, 146.2999° E.
Its readings come from the Victorian Department of Energy, Environment and Climate Action, from its Water Measurement Information System.
The Victorian Government codes each daily mean by quality. Its newest weeks are telemetry that it says must not be archived, so this site holds none of them: the newest value on a page is the newest day past that stage. The Department's validation lags two to five weeks behind as a rule, so a value on a Victorian page is usually two to five weeks old, and a value can change. Some stored days are unedited and show as provisional. Days the service marks as poor quality or missing, days at exactly zero and days it marks as dry have no value on this site, and a gauge dry for months has fewer days and fewer years than its record is long.