Wear catchment river levels today
Are the rivers and lakes in the Wear catchment unusually low or high?
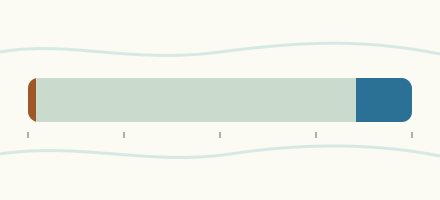
We follow 20 water level gauges in the Wear catchment. 1 gauge reads below its normal range for the date and 1 gauge above it.
How many gauges do we follow in the Wear catchment?
20 gauges of the 2,378 we follow in the United Kingdom, as of 21 November 2026.
How many waters in the Wear catchment have a level gauge?
10 waters with a level gauge, of the 1,152 waters we follow in the United Kingdom, as of 21 November 2026.
How many gauges read below normal for the date?
1 gauge below its normal range, of the 16 gauges with a current reading and a normal range for the date, as of 21 November 2026.
How many gauges read above normal for the date?
1 gauge above its normal range, of the 16 gauges with a current reading and a normal range for the date, as of 21 November 2026.
How the places stand today
1 place below normal and 1 place above
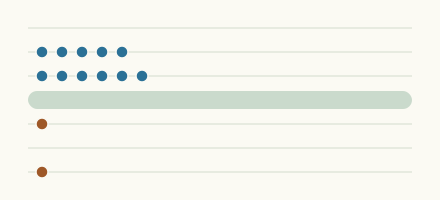
Which places are furthest below normal?
Which places are furthest above normal?
Which gauges do we follow in Wear?
| Place | Reading | Against normal for the date | Change in a day |
|---|---|---|---|
| Bedburn Beck | |||
| Bedburn | 0.247 m | -0.059 m | |
| Crook Beck | |||
| Crook West Bridge Street | 0.021 m | -0.015 m | |
| Killhope Burn | |||
| Wearhead | 0.164 m | within the normal range for the date | -0.057 m |
| Moors Burn | |||
| Houghton Le Spring | 0.182 m | within the normal range for the date | -0.037 m |
| Oakley Cross Beck | |||
| Oakley Cross Beck | 0.219 m | within the normal range for the date | -0.02 m |
| River Browney | |||
| Burn Hall | 0.15 m | within the normal range for the date | -0.079 m |
| River Gaunless | |||
| Copley | 0.291 m | in the highest 10 percent for the date | -0.042 m |
| Dovecote Hill | 0.512 m | within the normal range for the date | -0.044 m |
| Lowlands | 0.081 m | within the normal range for the date | -0.021 m |
| Ramshaw Mill | 0.145 m | -0.021 m | |
| South Church | 0.09 m | in the lowest 10 percent for the date | -0.04 m |
| Spring Gardens Dam | 0.555 m | -0.034 m | |
| West Auckland | 0.206 m | within the normal range for the date | -0.035 m |
| River Wear | |||
| Chester-Le-Street | 0.482 m | within the normal range for the date | -0.174 m |
| Durham New Elvet Bridge | 0.336 m | within the normal range for the date | -0.136 m |
| Stanhope | 0.418 m | within the normal range for the date | -0.152 m |
| Sunderland Bridge | 0.444 m | within the normal range for the date | -0.132 m |
| Witton Park | 0.52 m | within the normal range for the date | -0.134 m |
| Rookhope Burn | |||
| Eastgate | 0.102 m | within the normal range for the date | -0.051 m |
| Smallhope Burn | |||
| Lanchester Front Street | 0.26 m | within the normal range for the date | -0.026 m |
Keep exploring
 Country, United Kingdom Are the rivers and lakes in the United Kingdom unusually low or high? Every river and lake we follow here, against normal for the date.
 Today's list, United Kingdom Which places in the United Kingdom are furthest from normal today? The places in the United Kingdom furthest below and above normal today.
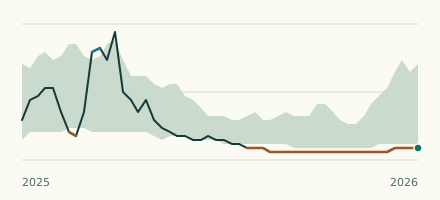 River gauge, United Kingdom Is the River Gaunless unusually low at South Church? Level now, history, the same date in past years and each year's range.
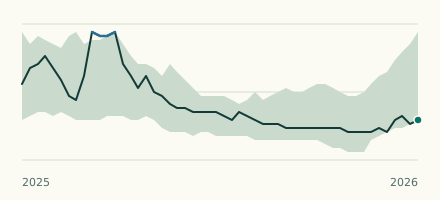 River gauge, United Kingdom Is the River Gaunless unusually high at Copley? Level now, history, the same date in past years and each year's range.