Vale of White Horse catchment river levels today
Are the rivers and lakes in the Vale of White Horse catchment unusually low or high?
We follow 53 water level gauges in the Vale of White Horse catchment. 7 gauges read below their normal range for the date and 1 gauge above it.
How many gauges do we follow in the Vale of White Horse catchment?
53 gauges of the 2,378 we follow in the United Kingdom, as of 21 November 2026.
How many waters in the Vale of White Horse catchment have a level gauge?
25 waters with a level gauge, of the 1,152 waters we follow in the United Kingdom, as of 21 November 2026.
How many gauges read below normal for the date?
7 gauges below their normal range, of the 41 gauges with a current reading and a normal range for the date, as of 21 November 2026.
How many gauges read above normal for the date?
1 gauge above its normal range, of the 41 gauges with a current reading and a normal range for the date, as of 21 November 2026.
How the places stand today
7 places below normal and 1 place above
Which places are furthest below normal?
More places
Which places are furthest above normal?
Which gauges do we follow in Vale of White Horse?
| Place | Reading | Against normal for the date | Change in a day |
|---|---|---|---|
| Bulstake Stream | |||
| New Botley | 1.123 m | within the normal range for the date | -0.081 m |
| Dorcan Brook | |||
| Kestrel Drive | 0.751 m | in the lowest 10 percent for the date | -0.056 m |
| Foudry Brook | |||
| Beech Hill | 0.766 m | within the normal range for the date | -0.081 m |
| Ginge Brook | |||
| Steventon | 0.469 m | in the lowest 5 percent for the date | -0.007 m |
| Hinksey Stream | |||
| Cold Harbour | 0.933 m | within the normal range for the date | -0.035 m |
| Hinksey Lake | 0.436 m | +0.008 m | |
| Kingsclere Brook | |||
| Kingsclere | 0.078 m | within the normal range for the date | 0 m |
| Letcombe Brook | |||
| Letcombe Bassett | 0.09 m | within the normal range for the date | -0.001 m |
| Letcombe Regis | -0.161 m | lower than any day of these dates in 34 years | -0.019 m |
| Wantage | 0.484 m | within the normal range for the date | -0.001 m |
| Mill Brook (Blewbury) | |||
| Blewbury | 0.10 m | within the normal range for the date | -0.002 m |
| Radley Park Ditch | |||
| Abingdon Peachcroft | 0.617 m | -0.016 m | |
| River Cole (Swindon) | |||
| Inglesham | 0.246 m | within the normal range for the date | -0.176 m |
| Lower Stratton | 2.025 m | within the normal range for the date | -0.052 m |
| River Dun (Berkshire) | |||
| Hungerford Dun | 0.058 m | within the normal range for the date | -0.003 m |
| River Enborne | |||
| Brimpton | 0.21 m | within the normal range for the date | -0.049 m |
| River Kennet | |||
| Blakes Lock | 0.076 m | within the normal range for the date | -0.014 m |
| Knighton Side | -0.069 m | lower than any day of these dates in 36 years | -0.009 m |
| Marlborough | 0.044 m | within the normal range for the date | -0.002 m |
| Newbury | 1.043 m | -0.029 m | |
| Reading Calcot Bridge | 2.008 m | -0.017 m | |
| Winterborne Monkton | -0.117 m | within the normal range for the date | +0.003 m |
| River Key | |||
| Purton Stoke | 0.915 m | within the normal range for the date | -0.296 m |
| River Lambourn | |||
| Eastbury Flood Control Structure | 0.786 m | -0.002 m | |
| Lambourn | 0.791 m | within the normal range for the date | +0.001 m |
| Shaw | 1.324 m | within the normal range for the date | -0.01 m |
| River Ock | |||
| Abingdon | 0.231 m | within the normal range for the date | -0.047 m |
| Charney Bassett | 1.019 m | -0.181 m | |
| Stanford Vale | 0.132 m | within the normal range for the date | -0.022 m |
| River Og | |||
| Poulton Farm | 0.063 m | -0.002 m | |
| River Pang | |||
| Bucklebury | 0.151 m | within the normal range for the date | -0.042 m |
| Frilsham | 0.004 m | in the lowest 10 percent for the date | -0.022 m |
| Pangbourne | 0.144 m | within the normal range for the date | -0.014 m |
| Tidmarsh | 1.24 m | within the normal range for the date | -0.061 m |
| River Ray (Wiltshire) | |||
| Rodbourne | 0.225 m | within the normal range for the date | -0.135 m |
| Rushey Platt | 0.794 m | within the normal range for the date | -0.043 m |
| Water Eaton | 1.64 m | -0.266 m | |
| River Shalbourne | |||
| Hungerford Shalbourne | 0.038 m | in the lowest 10 percent for the date | -0.002 m |
| River Stert | |||
| Abingdon | 0.597 m | within the normal range for the date | -0.017 m |
| River Thames | |||
| Benson Lock | 0.046 m | in the lowest 5 percent for the date | -0.036 m |
| Eynsham Lock | 0.111 m | -0.046 m | |
| Godstow Lock | 0.044 m | within the normal range for the date | -0.046 m |
| Grafton Lock | 0.129 m | within the normal range for the date | -0.052 m |
| Kings Lock | 0.201 m | within the normal range for the date | -0.027 m |
| Mapledurham Lock | 0.105 m | -0.057 m | |
| Osney Lock | 0.041 m | within the normal range for the date | -0.025 m |
| Radcot Lock | 0.162 m | within the normal range for the date | -0.066 m |
| Shifford Lock | 0.296 m | -0.044 m | |
| Sonning Lock | 0.26 m | in the highest 10 percent for the date | -0.063 m |
| Sutton Courtenay | 1.983 m | within the normal range for the date | -0.235 m |
| Seacourt Stream | |||
| Minns Estate | 1.418 m | -0.042 m | |
| Sulham Brook | |||
| Sulham | 0.07 m | within the normal range for the date | -0.003 m |
| Winterbourne Stream (Newbury) | |||
| Bagnor | 0.05 m | within the normal range for the date | -0.001 m |
Keep exploring
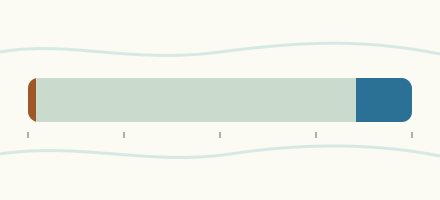 Country, United Kingdom Are the rivers and lakes in the United Kingdom unusually low or high? Every river and lake we follow here, against normal for the date.
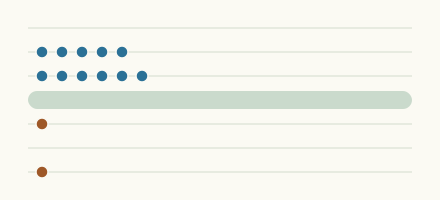 Today's list, United Kingdom Which places in the United Kingdom are furthest from normal today? The places in the United Kingdom furthest below and above normal today.
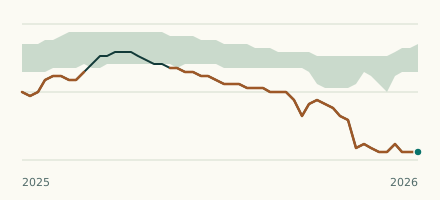 River gauge, United Kingdom Is the Letcombe Brook unusually low at Letcombe Regis? Level now, history, the same date in past years and each year's range.
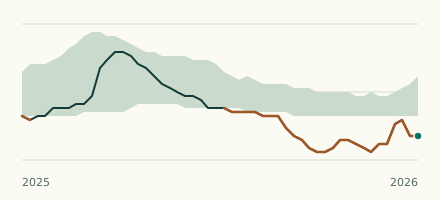 River gauge, United Kingdom Is the River Kennet unusually low at Knighton Side? Level now, history, the same date in past years and each year's range.