Tyne catchment river levels today
Are the rivers and lakes in the Tyne catchment unusually low or high?
We follow 36 water level gauges in the Tyne catchment. 2 gauges read below their normal range for the date and none above it.
How many gauges do we follow in the Tyne catchment?
36 gauges of the 2,378 we follow in the United Kingdom, as of 21 November 2026.
How many waters in the Tyne catchment have a level gauge?
16 waters with a level gauge, of the 1,152 waters we follow in the United Kingdom, as of 21 November 2026.
How many gauges read below normal for the date?
2 gauges below their normal range, of the 34 gauges with a current reading and a normal range for the date, as of 21 November 2026.
How many gauges read above normal for the date?
0 gauges above their normal range, of the 34 gauges with a current reading and a normal range for the date, as of 21 November 2026.
How the places stand today
2 places below normal and 0 places above
Which places are furthest below normal?
Which gauges do we follow in Tyne?
| Place | Reading | Against normal for the date | Change in a day |
|---|---|---|---|
| Birkey Burn | |||
| Acomb Garden House | -0.043 m | lower than any day of these dates in 11 years | -0.019 m |
| Cockshaw Burn | |||
| Hexham | 0.122 m | within the normal range for the date | -0.015 m |
| Hexham Tanners Row Downstream | -0.005 m | within the normal range for the date | 0 m |
| Hexham Tanners Row upstream | 0.656 m | within the normal range for the date | -0.01 m |
| Hareshaw Burn | |||
| Hareshaw Burn | 0.208 m | -0.019 m | |
| Kielder Burn | |||
| Kielder Burn | 0.245 m | within the normal range for the date | -0.058 m |
| Ouse Burn | |||
| Crag Hall | 0.181 m | within the normal range for the date | -0.055 m |
| Gosforth | 0.383 m | within the normal range for the date | -0.044 m |
| Woolsington | 0.052 m | within the normal range for the date | -0.019 m |
| Red Burn | |||
| Acomb Millersfield | 0.261 m | within the normal range for the date | -0.008 m |
| River Derwent (Durham) | |||
| Eddys Bridge | 0.303 m | within the normal range for the date | -0.012 m |
| River East Allen | |||
| Allen Mill Bridge | 0.309 m | within the normal range for the date | -0.074 m |
| River North Tyne | |||
| Bellingham | 0.306 m | within the normal range for the date | -0.058 m |
| Chollerford | 0.283 m | within the normal range for the date | -0.049 m |
| Falstone | 0.159 m | within the normal range for the date | -0.233 m |
| Kielder Butteryhaugh | 0.596 m | within the normal range for the date | -0.073 m |
| Reaverhill | 0.752 m | within the normal range for the date | -0.134 m |
| Ugly Dub | 0.333 m | within the normal range for the date | -0.233 m |
| River Rede | |||
| Otterburn | 0.56 m | within the normal range for the date | -0.08 m |
| Otterburn Mill | 0.417 m | within the normal range for the date | -0.109 m |
| Rede Bridge | 0.361 m | within the normal range for the date | -0.078 m |
| River South Tyne | |||
| Alston | 0.311 m | within the normal range for the date | -0.112 m |
| Featherstone | 0.32 m | within the normal range for the date | -0.114 m |
| Haydon Bridge | 0.477 m | within the normal range for the date | -0.133 m |
| Haydon Bridge Brigwood | 0.446 m | within the normal range for the date | -0.134 m |
| Warden Bridge End | 0.203 m | within the normal range for the date | -0.184 m |
| River Team | |||
| Tanfield | 0.254 m | within the normal range for the date | -0.043 m |
| Team Valley | 0.223 m | within the normal range for the date | -0.031 m |
| River Tyne | |||
| Bywell | 0.825 m | within the normal range for the date | -0.213 m |
| Corbridge | 0.508 m | within the normal range for the date | -0.184 m |
| Haltwhistle | 0.517 m | within the normal range for the date | -0.14 m |
| Hexham | 31.278 m | in the lowest 10 percent for the date | -0.122 m |
| Riding Mill | 0.90 m | within the normal range for the date | -0.27 m |
| River West Allen | |||
| Hindley Wrae Ford | 0.057 m | within the normal range for the date | -0.098 m |
| Stocksfield Burn | |||
| Stocksfield Ridley Mill | 0.261 m | -0.04 m | |
| Wydon Burn | |||
| Hexham Wydon Water | 0.008 m | within the normal range for the date | -0.005 m |
Keep exploring
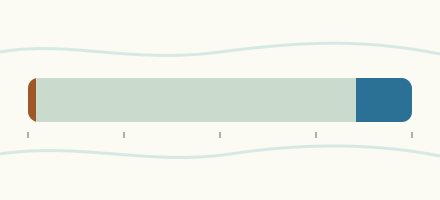 Country, United Kingdom Are the rivers and lakes in the United Kingdom unusually low or high? Every river and lake we follow here, against normal for the date.
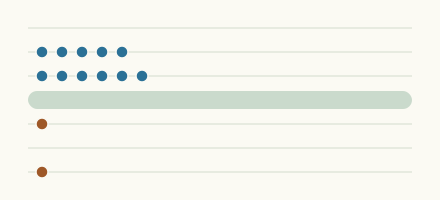 Today's list, United Kingdom Which places in the United Kingdom are furthest from normal today? The places in the United Kingdom furthest below and above normal today.
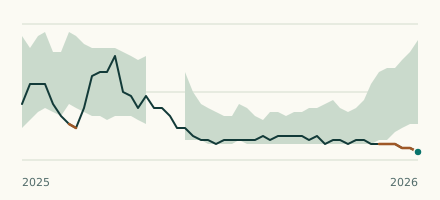 River gauge, United Kingdom Is the Birkey Burn unusually low at Acomb Garden House? Level now, history, the same date in past years and each year's range.
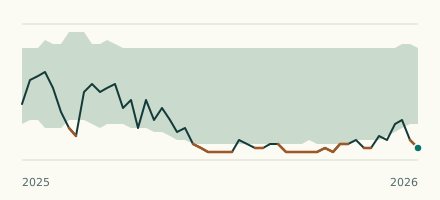 River gauge, United Kingdom Is the River Tyne unusually low at Hexham? Level now, history, the same date in past years and each year's range.