River Trent water level at Torksey today
How high is the River Trent at Torksey today?
The River Trent at Torksey read 2.991 m above Ordnance Datum Newlyn at .
Level now
2.991 m
Provisional
Where the water stands
Table: where the water stands
| Level | Value |
|---|---|
| Newest reading | 2.991 m, |
| Highest in our series | 6.191 m |
| Lowest in our series | 0.65 m |
- Past day
- -0.029 m
- Past week
- +0.843 m
Heights are given above Ordnance Datum Newlyn, the datum the source names (mAOD).
The last 12 months, week by week
- Level
- Our record
Table: The last 12 months, week by week
| Week starting | Weekly average (m) |
|---|---|
| 4.201 m | |
| 3.332 m | |
| 4.288 m | |
| 4.268 m | |
| 4.590 m | |
| 4.169 m | |
| 2.967 m | |
| 3.336 m | |
| 4.444 m | |
| 4.582 m | |
| 4.701 m | |
| 4.902 m | |
| 5.980 m | |
| 5.441 m | |
| 4.273 m | |
| 4.878 m | |
| 3.243 m | |
| 3.535 m | |
| 2.871 m | |
| 2.893 m | |
| 2.248 m | |
| 2.565 m | |
| 2.331 m | |
| 2.242 m | |
| 2.162 m | |
| 2.230 m | |
| 2.367 m | |
| 2.065 m | |
| 2.262 m | |
| 2.272 m | |
| 2.436 m | |
| 1.835 m | |
| 1.916 m | |
| 1.798 m | |
| 2.035 m | |
| 1.689 m | |
| 1.846 m | |
| 1.738 m | |
| 1.919 m | |
| 1.775 m | |
| 2.258 m | |
| 2.532 m | |
| 2.277 m | |
| 2.035 m | |
| 1.055 m | |
| 1.085 m | |
| 1.035 m | |
| 1.694 m | |
| 2.161 m | |
| 2.950 m | |
| 2.104 m | |
| 2.283 m | |
| 2.570 m |
Official levels
- Typical range, low: 1.4 m. It is set on another level measure of this station (4065-level-stage-i-15_min-mASD).another level measure of this station (4065-level-stage-i-15_min-mASD). Published by This uses Environment Agency flood and river level data from the real-time data API (Beta).
- Typical range, high: 4.65 m. It is set on another level measure of this station (4065-level-stage-i-15_min-mASD).another level measure of this station (4065-level-stage-i-15_min-mASD). Published by This uses Environment Agency flood and river level data from the real-time data API (Beta).
Records
- Highest reading in our series since 2 October 2025: 6.226 m at 04:15 GMT on 11 February 2026. Provisional data.
- Lowest reading in our series since 2 October 2025: 0.221 m at 05:30 BST on 23 September 2026. Provisional data.
- Highest daily average in our series since 2 October 2025: 6.191 m on 11 February 2026. Provisional data.
- Lowest daily average in our series since 2 October 2025: 0.65 m on 23 September 2026. Provisional data.
As the source publishes them
- Lowest on record: 1.296 m, on 22 July 1995. It is set on another level measure of this station (4065-level-stage-i-15_min-mASD).another level measure of this station (4065-level-stage-i-15_min-mASD). Published by This uses Environment Agency flood and river level data from the real-time data API (Beta).
- Highest in recent years: 6.502 m, on 27 December 2012. It is set on another level measure of this station (4065-level-stage-i-15_min-mASD).another level measure of this station (4065-level-stage-i-15_min-mASD). Published by This uses Environment Agency flood and river level data from the real-time data API (Beta).
- Highest on record: 7.423 m, on 6 January 2024. It is set on another level measure of this station (4065-level-stage-i-15_min-mASD).another level measure of this station (4065-level-stage-i-15_min-mASD). Published by This uses Environment Agency flood and river level data from the real-time data API (Beta).
Also on this water
About this gauge
Torksey is a gauge on the River Trent in the United Kingdom.
It lies at 53.2935° N, 0.7510° W.
Its readings come from the Environment Agency.
The Environment Agency says its real-time data should not be relied upon for safety critical applications.
The newest reading is provisional: the source may still correct it.
Keep exploring
 Catchment, United Kingdom Are the rivers and lakes in the Lower Trent and Erewash catchment unusually low or high? Every river and lake we follow here, against normal for the date.
 Country, United Kingdom Are the rivers and lakes in the United Kingdom unusually low or high? Every river and lake we follow here, against normal for the date.
 Today's list, United Kingdom Which places in the United Kingdom are furthest from normal today? The places in the United Kingdom furthest below and above normal today.
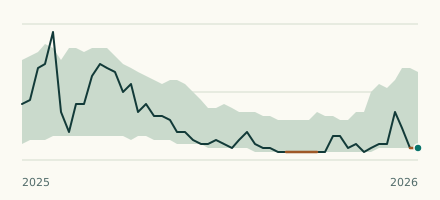 River gauge, United Kingdom Is the River Trent at Bucknall within its normal range for the date? Level now, history, the same date in past years and each year's range.
Sources
- This uses Environment Agency flood and river level data from the real-time data API (Beta) (source). Licence: Open Government Licence v3.0