Thames from Hurley to Teddington catchment river levels today
Are the rivers and lakes in the Thames from Hurley to Teddington catchment unusually low or high?
We follow 26 water level gauges in the Thames from Hurley to Teddington catchment. 4 gauges read below their normal range for the date and 1 gauge above it.
How many gauges do we follow in the Thames from Hurley to Teddington catchment?
26 gauges of the 2,378 we follow in the United Kingdom, as of 21 November 2026.
How many waters in the Thames from Hurley to Teddington catchment have a level gauge?
3 waters with a level gauge, of the 1,152 waters we follow in the United Kingdom, as of 21 November 2026.
How many gauges read below normal for the date?
4 gauges below their normal range, of the 19 gauges with a current reading and a normal range for the date, as of 21 November 2026.
How many gauges read above normal for the date?
1 gauge above its normal range, of the 19 gauges with a current reading and a normal range for the date, as of 21 November 2026.
How the places stand today
4 places below normal and 1 place above
Which places are furthest below normal?
Which places are furthest above normal?
Which gauges do we follow in Thames from Hurley to Teddington?
| Place | Reading | Against normal for the date | Change in a day |
|---|---|---|---|
| Jubilee River | |||
| Taplow | 1.645 m | -0.154 m | |
| Maidenhead Ditch | |||
| Raymill Road | 0.071 m | within the normal range for the date | -0.005 m |
| River Thames | |||
| Bell Weir | 0.113 m | -0.012 m | |
| Boulters Lock | 0.152 m | within the normal range for the date | -0.139 m |
| Boveney Lock | 0.206 m | -0.055 m | |
| Bray Lock | 0.171 m | within the normal range for the date | +0.018 m |
| Chertsey Lock | 0.292 m | within the normal range for the date | -0.013 m |
| Cookham Lock | 0.125 m | within the normal range for the date | -0.044 m |
| Hambleden Lock | 0.022 m | -0.119 m | |
| Hurley Lock | 0.032 m | -0.094 m | |
| Kingston | 4.515 m | within the normal range for the date | -0.085 m |
| Maidenhead | 2.289 m | in the lowest 10 percent for the date | -0.005 m |
| Marlow Lock | 0.144 m | within the normal range for the date | -0.032 m |
| Molesey Lock | 0.178 m | within the normal range for the date | -0.114 m |
| Old Windsor Lock | 0.117 m | in the lowest 10 percent for the date | -0.113 m |
| Penton Hook | 0.177 m | within the normal range for the date | +0.021 m |
| Romney Lock | 0.272 m | -0.02 m | |
| Shepperton Lock | 0.174 m | within the normal range for the date | -0.067 m |
| Staines | 2.732 m | in the lowest 10 percent for the date | +0.026 m |
| Sunbury Lock | 0.308 m | in the highest 5 percent for the date | -0.042 m |
| Teddington Lock | 0.133 m | within the normal range for the date | -0.062 m |
| Temple Lock | 0.082 m | -0.016 m | |
| Thames Ditton Island | 4.498 m | in the lowest 10 percent for the date | -0.099 m |
| Trowlock Island | 4.555 m | within the normal range for the date | -0.072 m |
| Walton | 3.415 m | within the normal range for the date | -0.042 m |
| Windsor Park | 3.217 m | within the normal range for the date | -0.115 m |
Keep exploring
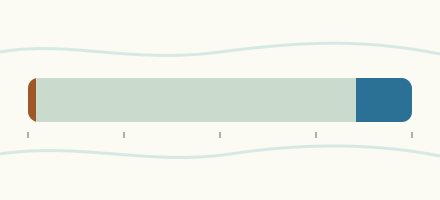 Country, United Kingdom Are the rivers and lakes in the United Kingdom unusually low or high? Every river and lake we follow here, against normal for the date.
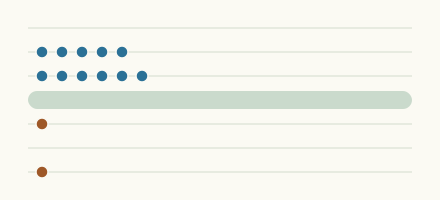 Today's list, United Kingdom Which places in the United Kingdom are furthest from normal today? The places in the United Kingdom furthest below and above normal today.
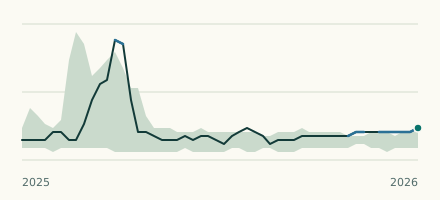 River gauge, United Kingdom Is the River Thames unusually low at Old Windsor Lock? Level now, history, the same date in past years and each year's range.
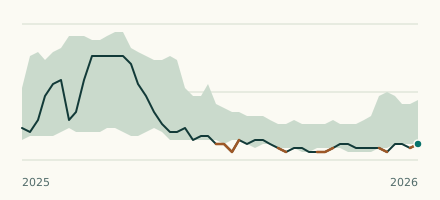 River gauge, United Kingdom Is the River Thames unusually low at Maidenhead? Level now, history, the same date in past years and each year's range.