Test and Itchen catchment river levels today
Are the rivers and lakes in the Test and Itchen catchment unusually low or high?
We follow 42 water level gauges in the Test and Itchen catchment. 9 gauges read below their normal range for the date and none above it.
How many gauges do we follow in the Test and Itchen catchment?
42 gauges of the 2,378 we follow in the United Kingdom, as of 21 November 2026.
How many waters in the Test and Itchen catchment have a level gauge?
19 waters with a level gauge, of the 1,152 waters we follow in the United Kingdom, as of 21 November 2026.
How many gauges read below normal for the date?
9 gauges below their normal range, of the 19 gauges with a current reading and a normal range for the date, as of 21 November 2026.
How many gauges read above normal for the date?
0 gauges above their normal range, of the 19 gauges with a current reading and a normal range for the date, as of 21 November 2026.
How the places stand today
9 places below normal and 0 places above
Which places are furthest below normal?
More places
Which gauges do we follow in Test and Itchen?
| Place | Reading | Against normal for the date | Change in a day |
|---|---|---|---|
| Barge Canal | |||
| Plaza Grill | 16.421 m | within the normal range for the date | +0.006 m |
| Bourne Rivulet | |||
| Hurstbourne Priors | 0.183 m | -0.005 m | |
| St Mary Bourne | 77.774 m | lower than any day of these dates in 13 years | -0.015 m |
| Candover Stream | |||
| Borough Bridge weir | 0.142 m | within the normal range for the date | +0.892 m |
| Cheriton Stream | |||
| Sewards Bridge | 0.16 m | within the normal range for the date | -0.003 m |
| Fishlake Stream | |||
| Fishlake | 0.475 m | -0.02 m | |
| Monks Brook | |||
| Chandler's Ford | 0.104 m | -0.025 m | |
| Stoneham Lane | 0.135 m | -0.044 m | |
| Oxlease Drain | |||
| Brewery Grill | 16.844 m | in the lowest 10 percent for the date | -0.02 m |
| Pillhill Brook | |||
| Upper Clatford | 52.317 m | -0.004 m | |
| River Alre | |||
| Drove Lane | 0.233 m | within the normal range for the date | -0.005 m |
| Drove Lane 1.5 | 0.351 m | within the normal range for the date | -0.003 m |
| River Anton | |||
| Andover Town Mill | 56.56 m | -0.004 m | |
| Fullerton Main | -0.187 m | -0.007 m | |
| Fullerton Side | 0.022 m | lower than any day of these dates in 42 years | -0.002 m |
| River Dever | |||
| Bransbury | 0.477 m | -0.002 m | |
| River Dun (Hampshire) | |||
| Dunbridge | 22.974 m | in the lowest 5 percent for the date | -0.003 m |
| River Itchen | |||
| Allbrook weir | 0.304 m | -0.008 m | |
| Bishopstoke | 0.62 m | -0.166 m | |
| City Mill | 0.344 m | -0.005 m | |
| Durngate | 37.158 m | within the normal range for the date | -0.018 m |
| Easton | 0.486 m | lower than any day of these dates in 26 years | -0.01 m |
| Highbridge weir | 0.318 m | -0.012 m | |
| Riverside Park | 1.429 m | in the lowest 5 percent for the date | -0.087 m |
| Stoke Lock | 12.845 m | within the normal range for the date | -0.117 m |
| Wharf Mill | 0.345 m | -0.006 m | |
| River Swift (Hampshire) | |||
| St Bedes | 36.391 m | -0.02 m | |
| River Test | |||
| Chilbolton Side | 0.668 m | in the lowest 5 percent for the date | +0.003 m |
| Conagar Bridge | 0.479 m | within the normal range for the date | -0.022 m |
| Longbridge | 0.774 m | -0.024 m | |
| Oxlease | 14.921 m | -0.007 m | |
| Rivermead | 11.13 m | +0.123 m | |
| Stockbridge Main | 33.881 m | in the lowest 10 percent for the date | -0.017 m |
| Stockbridge Side | 0.47 m | -0.01 m | |
| Wherwell | 0.209 m | -0.003 m | |
| Whitchurch Main | 0.015 m | in the lowest 10 percent for the date | -0.009 m |
| Whitchurch Side | 0.11 m | within the normal range for the date | -0.007 m |
| Somborne Stream | |||
| Kings Somborne | 33.171 m | +0.011 m | |
| Tadburn Lake | |||
| Romsey Botley Road | 0.347 m | -0.025 m | |
| Tanners Brook | |||
| Millbrook | 0.079 m | within the normal range for the date | -0.01 m |
| Shirley Pond | 13.331 m | -0.117 m | |
| Wallop Brook | |||
| Bossington | 0.091 m | -0.003 m | |
Keep exploring
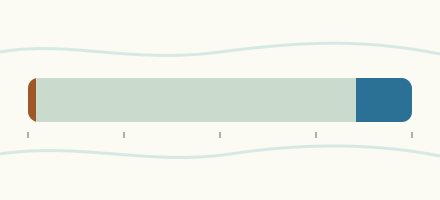 Country, United Kingdom Are the rivers and lakes in the United Kingdom unusually low or high? Every river and lake we follow here, against normal for the date.
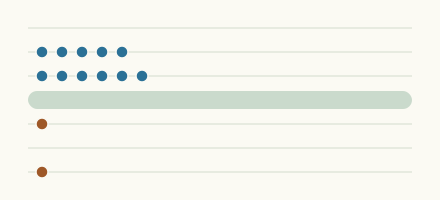 Today's list, United Kingdom Which places in the United Kingdom are furthest from normal today? The places in the United Kingdom furthest below and above normal today.
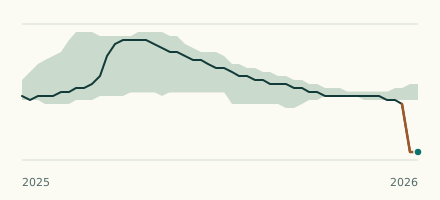 River gauge, United Kingdom Is the Bourne Rivulet unusually low at St Mary Bourne? Level now, history, the same date in past years and each year's range.
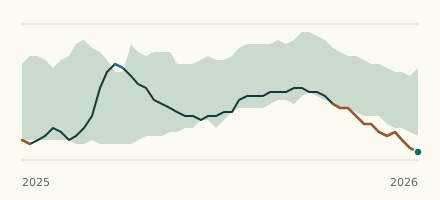 River gauge, United Kingdom Is the River Itchen unusually low at Easton? Level now, history, the same date in past years and each year's range.