Tees catchment river levels today
Are the rivers and lakes in the Tees catchment unusually low or high?
We follow 31 water level gauges in the Tees catchment. 4 gauges read below their normal range for the date and 1 gauge above it.
How many gauges do we follow in the Tees catchment?
31 gauges of the 2,378 we follow in the United Kingdom, as of 21 November 2026.
How many waters in the Tees catchment have a level gauge?
16 waters with a level gauge, of the 1,152 waters we follow in the United Kingdom, as of 21 November 2026.
How many gauges read below normal for the date?
4 gauges below their normal range, of the 21 gauges with a current reading and a normal range for the date, as of 21 November 2026.
How many gauges read above normal for the date?
1 gauge above its normal range, of the 21 gauges with a current reading and a normal range for the date, as of 21 November 2026.
How the places stand today
4 places below normal and 1 place above
Which places are furthest below normal?
Which places are furthest above normal?
Which gauges do we follow in Tees?
| Place | Reading | Against normal for the date | Change in a day |
|---|---|---|---|
| Burn Valley Beck | |||
| Hartlepool Burn Valley Gardens | 0.097 m | -0.039 m | |
| Hartlepool Valley Drive | 0.053 m | -0.028 m | |
| Clow Beck | |||
| Croft Monk End Farm | 0.74 m | in the lowest 10 percent for the date | -0.071 m |
| Cowbridge Beck | |||
| Billingham Pennington Close | 0.048 m | 0 m | |
| Hartburn Beck | |||
| Stockton Hartburn Bridge | 0.459 m | within the normal range for the date | -0.058 m |
| Harwood Beck | |||
| Harwood | 0.27 m | within the normal range for the date | -0.102 m |
| Kilton Beck | |||
| Skinningrove | 5.052 m | within the normal range for the date | -0.064 m |
| Loftus Beck | |||
| Loftus East Crescent | 0.343 m | -0.008 m | |
| Lustrum Beck | |||
| Stockton Primrose Hill | 0.113 m | within the normal range for the date | -0.061 m |
| Marton West Beck | |||
| Middlesbrough Albert Park | 0.044 m | in the lowest 5 percent for the date | -0.035 m |
| Middlesbrough Albert Park Footbridge | 0.015 m | -0.025 m | |
| Ormesby Beck | |||
| Middlesbrough Ormesby Hall | 0.02 m | within the normal range for the date | -0.008 m |
| River Greta (Durham) | |||
| Rutherford Bridge | 0.378 m | within the normal range for the date | -0.108 m |
| River Leven | |||
| Easby | 0.114 m | in the lowest 10 percent for the date | -0.022 m |
| Foxton Bridge | 0.247 m | within the normal range for the date | -0.053 m |
| Great Ayton | 0.05 m | in the lowest 5 percent for the date | -0.022 m |
| Stokesley | 0.14 m | within the normal range for the date | -0.057 m |
| Stokesley Downstream | 0.701 m | within the normal range for the date | -0.105 m |
| Stokesley Upstream | 0.518 m | -0.084 m | |
| River Skerne | |||
| John St Darlington | 0.27 m | within the normal range for the date | -0.091 m |
| South Park | 0.301 m | within the normal range for the date | -0.055 m |
| River Tees | |||
| Barnard Castle | 0.538 m | within the normal range for the date | -0.115 m |
| Broken Scar | 0.835 m | -0.161 m | |
| Hurworth | 0.559 m | -0.335 m | |
| Low Moor | 0.57 m | within the normal range for the date | -0.416 m |
| Middleton | 0.494 m | within the normal range for the date | -0.149 m |
| Stockton | 2.793 m | higher than any day of these dates in 31 years | +0.101 m |
| Tees Dock | 0.397 m | -0.675 m | |
| Yarm | 0.582 m | within the normal range for the date | -0.011 m |
| Trout Beck (Teesdale) | |||
| Moorhouse | 0.162 m | within the normal range for the date | -0.102 m |
| West Beck (Darlington) | |||
| Darlington Faverdale | 0.183 m | -0.029 m | |
Keep exploring
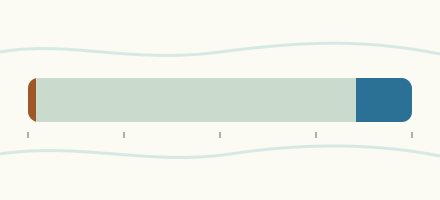 Country, United Kingdom Are the rivers and lakes in the United Kingdom unusually low or high? Every river and lake we follow here, against normal for the date.
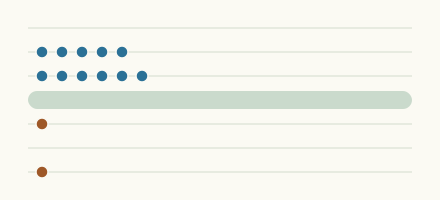 Today's list, United Kingdom Which places in the United Kingdom are furthest from normal today? The places in the United Kingdom furthest below and above normal today.
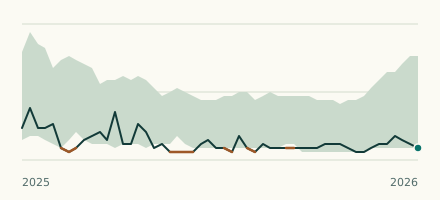 River gauge, United Kingdom Is the Marton West Beck unusually low at Middlesbrough Albert Park? Level now, history, the same date in past years and each year's range.
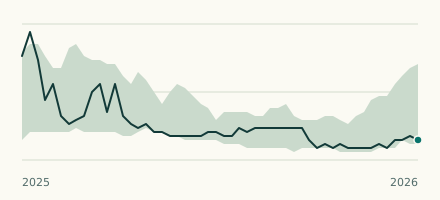 River gauge, United Kingdom Is the River Leven unusually low at Great Ayton? Level now, history, the same date in past years and each year's range.