Swale, Ure, Nidd and Upper Ouse catchment river levels today
Are the rivers and lakes in the Swale, Ure, Nidd and Upper Ouse catchment unusually low or high?
We follow 56 water level places in the Swale, Ure, Nidd and Upper Ouse catchment. 6 places read below their normal range for the date and none above it.
How many places do we follow in the Swale, Ure, Nidd and Upper Ouse catchment?
56 places of the 2,378 we follow in the United Kingdom, as of 21 November 2026.
How many waters in the Swale, Ure, Nidd and Upper Ouse catchment have a level gauge?
27 waters with a level gauge, of the 1,152 waters we follow in the United Kingdom, as of 21 November 2026.
How many places read below normal for the date?
6 places below their normal range, of the 41 places with a current reading and a normal range for the date, as of 21 November 2026.
How many places read above normal for the date?
0 places above their normal range, of the 41 places with a current reading and a normal range for the date, as of 21 November 2026.
How the places stand today
6 places below normal and 0 places above
Which places are furthest below normal?
More places
Which gauges do we follow in Swale, Ure, Nidd and Upper Ouse?
| Place | Reading | Against normal for the date | Change in a day |
|---|---|---|---|
| Arkle Beck | |||
| Reeth | 0.065 m | within the normal range for the date | -0.146 m |
| Bedale Beck | |||
| Leeming | 0.273 m | within the normal range for the date | -0.146 m |
| Bishop Monkton Beck | |||
| Bishop Monkton | 0.163 m | -0.001 m | |
| Brompton Beck (Northallerton) | |||
| Brompton | 0.13 m | within the normal range for the date | -0.059 m |
| Brough Beck | |||
| Catterick Brough Park | 0.085 m | -0.039 m | |
| Catterick Village | 0.239 m | within the normal range for the date | -0.033 m |
| Browney Dyke | |||
| York Foss Barrier | 5.853 m | -0.459 m | |
| Cod Beck | |||
| Dalton | 1.089 m | within the normal range for the date | -0.079 m |
| Kirby Sigston | 0.221 m | in the lowest 5 percent for the date | -0.019 m |
| Thirsk | 0.156 m | -0.033 m | |
| Cundall Beck | |||
| Bat Bridge | 0.116 m | within the normal range for the date | -0.005 m |
| Gouthwaite Reservoir | |||
| Gouthwaite Reservoir | 10.769 m | -0.048 m | |
| Holgate Beck | |||
| Holgate | 0.525 m | within the normal range for the date | -0.557 m |
| River Crimple | |||
| Blackstones Farm | 0.176 m | in the lowest 5 percent for the date | -0.036 m |
| Burn Bridge | 0.067 m | -0.015 m | |
| River Foss | |||
| Huntington | 0.718 m | in the lowest 10 percent for the date | -0.012 m |
| West Lilling | 0.36 m | -0.048 m | |
| York Castle Mills Sluices | 7.571 m | +0.004 m | |
| River Kyle | |||
| Newton on Ouse | 0.903 m | -1.075 m | |
| River Laver | |||
| Ripon | 0.072 m | within the normal range for the date | -0.05 m |
| Ripon Birkby Nab | 0.327 m | -0.087 m | |
| River Nidd | |||
| Birstwith | 0.337 m | within the normal range for the date | +0.035 m |
| Gouthwaite | 0.191 m | within the normal range for the date | -0.019 m |
| Hunsingore | 0.172 m | within the normal range for the date | -0.003 m |
| Pateley Bridge | 0.234 m | within the normal range for the date | +0.043 m |
| Skip Bridge | 1.153 m | within the normal range for the date | -0.26 m |
| River Ouse (Yorkshire) | |||
| Clifton Ings Outfall | 5.964 m | within the normal range for the date | -0.542 m |
| Monkton | 1.372 m | within the normal range for the date | -0.796 m |
| Skelton | 1.547 m | within the normal range for the date | -0.698 m |
| Viking Recorder | 0.922 m | within the normal range for the date | -0.488 m |
| York Foss Barrier | 5.863 m | -0.459 m | |
| River Skell | |||
| Alma Weir | 0.208 m | within the normal range for the date | -0.065 m |
| River Swale | |||
| Catterick Bridge | 0.576 m | within the normal range for the date | -0.218 m |
| Crakehill | 0.886 m | within the normal range for the date | -1.79 m |
| Grinton Bridge | 0.153 m | within the normal range for the date | -0.169 m |
| Maunby | 0.877 m | within the normal range for the date | -1.851 m |
| Myton-On-Swale | 1.552 m | within the normal range for the date | -1.073 m |
| Park Bridge | 0.215 m | -0.148 m | |
| Richmond Lownthwaite Bridge | 0.282 m | within the normal range for the date | -0.195 m |
| River Tutt | |||
| Boroughbridge | 11.861 m | -0.008 m | |
| River Ure | |||
| Aldwark Bridge | 0.817 m | within the normal range for the date | -0.591 m |
| Bainbridge | 0.429 m | within the normal range for the date | -0.125 m |
| Boroughbridge | 9.848 m | within the normal range for the date | -0.922 m |
| Kilgram | 0.649 m | within the normal range for the date | -0.25 m |
| Masham | 0.495 m | within the normal range for the date | -0.195 m |
| Ripon Ure Bank | 0.242 m | within the normal range for the date | -0.165 m |
| Westwick Weir | 0.294 m | within the normal range for the date | -0.343 m |
| River Wharfe | |||
| Bolton Percy | 5.116 m | in the lowest 10 percent for the date | -0.001 m |
| River Wiske | |||
| Kirby Wiske | 0.245 m | within the normal range for the date | -0.785 m |
| Viewly Bridge | 0.229 m | -0.008 m | |
| Snaizeholme Beck | |||
| Low Houses | 0.178 m | within the normal range for the date | -0.052 m |
| Sour Beck | |||
| Catterick Garrison | 0.079 m | in the lowest 10 percent for the date | -0.009 m |
| Swinney Beck | |||
| Masham, Swinney Beck | 0.103 m | -0.008 m | |
| Tang Hall Beck | |||
| York James Street Trashscreen | 5.868 m | within the normal range for the date | -0.454 m |
| Willow Beck | |||
| Northallerton | 0.266 m | within the normal range for the date | -0.02 m |
| Romanby | 0.02 m | lower than any day of these dates in 20 years | -0.014 m |
Keep exploring
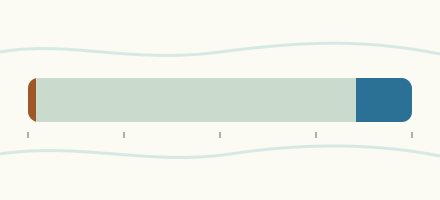 Country, United Kingdom Are the rivers and lakes in the United Kingdom unusually low or high? Every river and lake we follow here, against normal for the date.
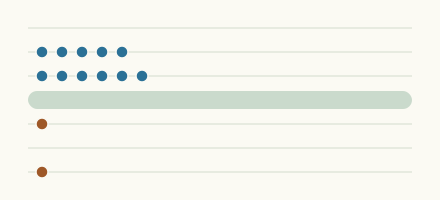 Today's list, United Kingdom Which places in the United Kingdom are furthest from normal today? The places in the United Kingdom furthest below and above normal today.
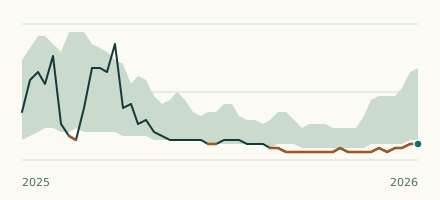 River gauge, United Kingdom Is the Willow Beck unusually low at Romanby? Level now, history, the same date in past years and each year's range.
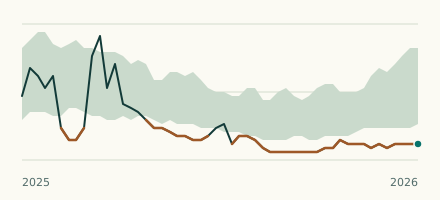 River gauge, United Kingdom Is the Cod Beck unusually low at Kirby Sigston? Level now, history, the same date in past years and each year's range.