New Forest catchment river levels today
Are the rivers and lakes in the New Forest catchment unusually low or high?
We follow 12 water level gauges in the New Forest catchment. None read below their normal range for the date and none above it.
How many gauges do we follow in the New Forest catchment?
12 gauges of the 2,378 we follow in the United Kingdom, as of 21 November 2026.
How many waters in the New Forest catchment have a level gauge?
6 waters with a level gauge, of the 1,152 waters we follow in the United Kingdom, as of 21 November 2026.
How many gauges read below normal for the date?
0 gauges below their normal range, of the 4 gauges with a current reading and a normal range for the date, as of 21 November 2026.
How many gauges read above normal for the date?
0 gauges above their normal range, of the 4 gauges with a current reading and a normal range for the date, as of 21 November 2026.
How the places stand today
0 places below normal and 0 places above
Which gauges do we follow in New Forest?
| Place | Reading | Against normal for the date | Change in a day |
|---|---|---|---|
| Bartley Water | |||
| Ashurst Bridge | 3.865 m | -0.067 m | |
| Eling | 1.65 m | +0.522 m | |
| Totton | 1.626 m | +0.507 m | |
| Beaulieu River | |||
| Hartford | 1.53 m | +0.022 m | |
| Danes Stream | |||
| Milford Bridge | 1.083 m | within the normal range for the date | -0.09 m |
| New Valley Road | 0.052 m | -0.035 m | |
| Lymington River | |||
| Brockenhurst | 0.468 m | -0.068 m | |
| Lymington | 1.085 m | +0.283 m | |
| Lymington River level | 0.212 m | within the normal range for the date | -0.261 m |
| Meerut Road | 0.057 m | -0.03 m | |
| River Blackwater (New Forest) | |||
| Ower | 0.259 m | within the normal range for the date | -0.038 m |
| Walkford Brook | |||
| Chewton Glen | 0.144 m | within the normal range for the date | -0.023 m |
Keep exploring
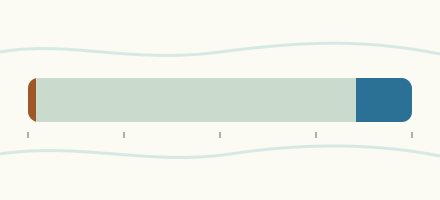 Country, United Kingdom Are the rivers and lakes in the United Kingdom unusually low or high? Every river and lake we follow here, against normal for the date.
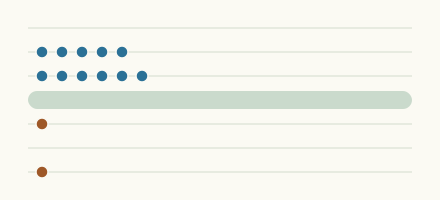 Today's list, United Kingdom Which places in the United Kingdom are furthest from normal today? The places in the United Kingdom furthest below and above normal today.
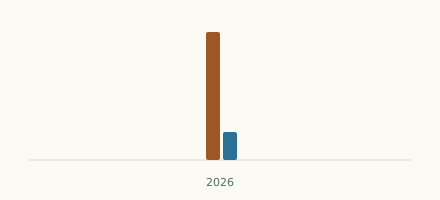 Records, world Which places have set a new record low or high? Record lows and highs in our data, and the newest set.
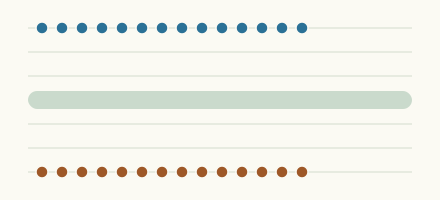 Today's list, world Which places are furthest from normal today? The places furthest below and above normal today.