Lower Mersey catchment river levels today
Are the rivers and lakes in the Lower Mersey catchment unusually low or high?
We follow 30 water level gauges in the Lower Mersey catchment. 1 gauge reads below its normal range for the date and none above it.
How many gauges do we follow in the Lower Mersey catchment?
30 gauges of the 2,378 we follow in the United Kingdom, as of 21 November 2026.
How many waters in the Lower Mersey catchment have a level gauge?
22 waters with a level gauge, of the 1,152 waters we follow in the United Kingdom, as of 21 November 2026.
How many gauges read below normal for the date?
1 gauge below its normal range, of the 17 gauges with a current reading and a normal range for the date, as of 21 November 2026.
How many gauges read above normal for the date?
0 gauges above their normal range, of the 17 gauges with a current reading and a normal range for the date, as of 21 November 2026.
How the places stand today
1 place below normal and 0 places above
Which places are furthest below normal?
Which gauges do we follow in Lower Mersey?
| Place | Reading | Against normal for the date | Change in a day |
|---|---|---|---|
| Arrowe Brook | |||
| Acton Lane | 0.191 m | within the normal range for the date | -0.066 m |
| Greasby Road | 0.246 m | within the normal range for the date | -0.02 m |
| Atherton Lake Brook | |||
| Howe Bridge | 0.086 m | within the normal range for the date | -0.025 m |
| Lilford Park, Leigh | 0.275 m | within the normal range for the date | -0.24 m |
| Black Brook (Haydock) | |||
| Haydock West End Road | 0.11 m | -0.025 m | |
| Borsdane Brook | |||
| First Avenue | 0.199 m | within the normal range for the date | -0.064 m |
| Romford Street, Hindley | 0.155 m | -0.046 m | |
| Carr Brook (Atherton) | |||
| Atherton Woodland Drive | 0.155 m | -0.039 m | |
| Dovers Brook | |||
| Dovers Bridge | 0.511 m | -0.037 m | |
| Ellenor Brook | |||
| Size Bridge, Tyldesley | 0.117 m | within the normal range for the date | -0.039 m |
| Glaze Brook | |||
| Little Woolden Hall | 0.594 m | within the normal range for the date | -0.178 m |
| Hey Brook | |||
| Platt Bridge, Templeton Road | 0.423 m | -0.129 m | |
| Manchester Ship Canal | |||
| Ferry Lane, Warrington | 0.41 m | -0.118 m | |
| Millingford Brook | |||
| Ivy Street, Ashton-In-Makerfield | 0.26 m | within the normal range for the date | -0.045 m |
| Lincoln Drive | 0.322 m | within the normal range for the date | -0.062 m |
| Morris Brook | |||
| Morris Brook | 0.076 m | -0.034 m | |
| Netherley Brook | |||
| Winster Drive | 0.422 m | within the normal range for the date | -0.126 m |
| Rivacre Brook | |||
| Chase Way, Ellesmere Port | 0.173 m | -0.017 m | |
| River Alt | |||
| Kirkby | 0.246 m | within the normal range for the date | -0.045 m |
| River Birket | |||
| Davis Road | 0.774 m | -0.215 m | |
| Fornalls Bridge | 0.552 m | -0.057 m | |
| River Gowy | |||
| Bridge Trafford | 0.322 m | within the normal range for the date | -0.018 m |
| River Mersey | |||
| Fiddlers Ferry | 3.369 m | +0.592 m | |
| Westy | 3.812 m | within the normal range for the date | -0.085 m |
| Sankey Brook | |||
| Causey Bridge | 0.334 m | within the normal range for the date | -0.104 m |
| Higham Avenue | 0.481 m | within the normal range for the date | -0.173 m |
| Liverpool Road | 1.581 m | within the normal range for the date | -0.13 m |
| Shakerley Brook | |||
| Atherton Shakerley Road | 0.18 m | -0.067 m | |
| Sutton Mill Brook | |||
| Ellamsbridge Road, St Helens | 0.167 m | in the lowest 10 percent for the date | -0.091 m |
| Westleigh Brook | |||
| Sportsman Street, Leigh | 0.202 m | -0.063 m | |
Keep exploring
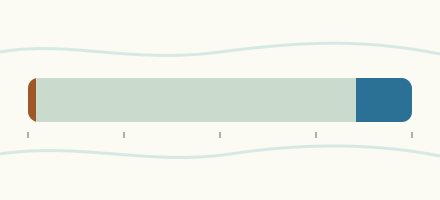 Country, United Kingdom Are the rivers and lakes in the United Kingdom unusually low or high? Every river and lake we follow here, against normal for the date.
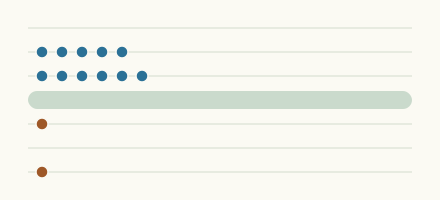 Today's list, United Kingdom Which places in the United Kingdom are furthest from normal today? The places in the United Kingdom furthest below and above normal today.
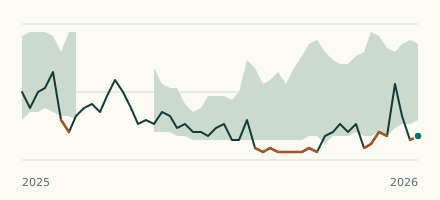 River gauge, United Kingdom Is the Sutton Mill Brook unusually low at Ellamsbridge Road, St Helens? Level now, history, the same date in past years and each year's range.
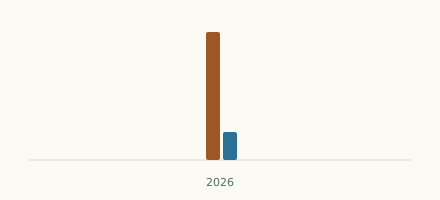 Records, world Which places have set a new record low or high? Record lows and highs in our data, and the newest set.