Lower Lee catchment river levels today
Are the rivers and lakes in the Lower Lee catchment unusually low or high?
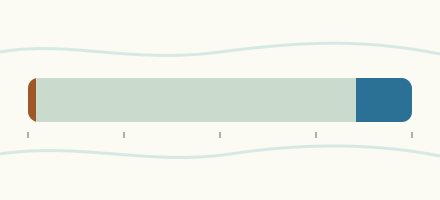
We follow 19 water level gauges in the Lower Lee catchment. 3 gauges read below their normal range for the date and 1 gauge above it.
How many gauges do we follow in the Lower Lee catchment?
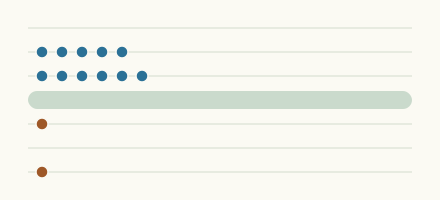
19 gauges of the 2,378 we follow in the United Kingdom, as of 21 November 2026.
How many waters in the Lower Lee catchment have a level gauge?
11 waters with a level gauge, of the 1,152 waters we follow in the United Kingdom, as of 21 November 2026.
How many gauges read below normal for the date?
3 gauges below their normal range, of the 12 gauges with a current reading and a normal range for the date, as of 21 November 2026.
How many gauges read above normal for the date?
1 gauge above its normal range, of the 12 gauges with a current reading and a normal range for the date, as of 21 November 2026.
How the places stand today
3 places below normal and 1 place above
Which places are furthest below normal?
Which places are furthest above normal?
Which gauges do we follow in Lower Lee?
| Place | Reading | Against normal for the date | Change in a day |
|---|---|---|---|
| Amwell Loop | |||
| Tumbling Bay Weir | 30.386 m | +0.003 m | |
| Ching Brook | |||
| Chingford | 0.208 m | -0.012 m | |
| Walthamstow | 1.032 m | in the lowest 10 percent for the date | -0.021 m |
| Cobbins Brook | |||
| Waltham Abbey | 0.121 m | within the normal range for the date | -0.043 m |
| Waltham Abbey, Sewardstone Road | 0.128 m | within the normal range for the date | -0.034 m |
| Nazeing Brook | |||
| Lower Nazeing | 1.00 m | -0.034 m | |
| Pymmes Brook | |||
| Arnos Park | 2.591 m | ||
| Edmonton, Silver Street | 0.021 m | -0.013 m | |
| New Barnet | 0.146 m | within the normal range for the date | -0.002 m |
| Powys Lane | 0.657 m | -0.016 m | |
| Rags Brook | |||
| Cheshunt, Rosedale Way | 0.803 m | in the lowest 10 percent for the date | -0.012 m |
| River Lee | |||
| Lea Bridge | 5.874 m | in the highest 5 percent for the date | -0.001 m |
| Walthamstow, Low Hall | 0.182 m | within the normal range for the date | +0.041 m |
| Salmon Brook | |||
| Edmonton Green | 0.10 m | within the normal range for the date | -0.029 m |
| Enfield, The Chine | 0.943 m | in the lowest 5 percent for the date | -0.025 m |
| Small River Lee | |||
| Cheshunt, Windmill Lane | 0.648 m | within the normal range for the date | -0.092 m |
| Enfield, Ordance Road | 0.128 m | within the normal range for the date | -0.031 m |
| Theobalds Brook | |||
| Cheshunt, Trinity Lane | 0.418 m | -0.022 m | |
| Turkey Brook | |||
| Enfield, Albany Park | 0.105 m | within the normal range for the date | -0.034 m |
Keep exploring
 Country, United Kingdom Are the rivers and lakes in the United Kingdom unusually low or high? Every river and lake we follow here, against normal for the date.
 Today's list, United Kingdom Which places in the United Kingdom are furthest from normal today? The places in the United Kingdom furthest below and above normal today.
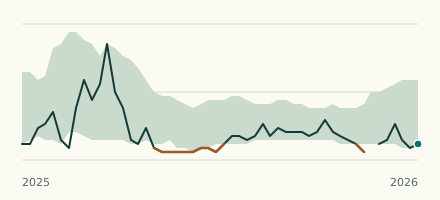 River gauge, United Kingdom Is the Salmon Brook unusually low at Enfield, The Chine? Level now, history, the same date in past years and each year's range.
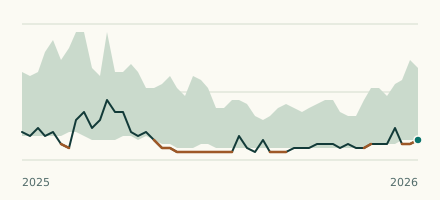 River gauge, United Kingdom Is the Ching Brook unusually low at Walthamstow? Level now, history, the same date in past years and each year's range.