East Hampshire catchment river levels today
Are the rivers and lakes in the East Hampshire catchment unusually low or high?
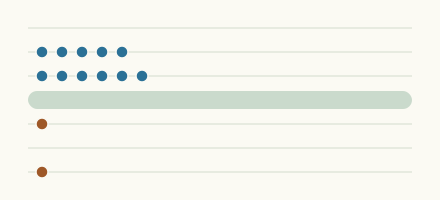
We follow 19 water level gauges in the East Hampshire catchment. 2 gauges read below their normal range for the date and none above it.
How many gauges do we follow in the East Hampshire catchment?
19 gauges of the 2,378 we follow in the United Kingdom, as of 21 November 2026.
How many waters in the East Hampshire catchment have a level gauge?
9 waters with a level gauge, of the 1,152 waters we follow in the United Kingdom, as of 21 November 2026.
How many gauges read below normal for the date?
2 gauges below their normal range, of the 7 gauges with a current reading and a normal range for the date, as of 21 November 2026.
How many gauges read above normal for the date?
0 gauges above their normal range, of the 7 gauges with a current reading and a normal range for the date, as of 21 November 2026.
How the places stand today
2 places below normal and 0 places above
Which places are furthest below normal?
Which gauges do we follow in East Hampshire?
| Place | Reading | Against normal for the date | Change in a day |
|---|---|---|---|
| Brownwich Stream | |||
| Brownwich Pond | 1.076 m | within the normal range for the date | -0.027 m |
| Hermitage Stream | |||
| Havant | 5.111 m | -0.005 m | |
| Petersfield Stream | |||
| Borough Grove | 59.179 m | 0 m | |
| Winchester Road | 64.853 m | -0.037 m | |
| River Alver | |||
| Browndown | 0.886 m | -0.08 m | |
| River Hamble | |||
| Frogmill | 0.093 m | -0.033 m | |
| Hobb Lane | 20.618 m | in the lowest 5 percent for the date | -0.019 m |
| North Pond | 34.306 m | in the lowest 10 percent for the date | 0 m |
| River Lavant (Hampshire) | |||
| Crosslands Drive | 0.137 m | -0.01 m | |
| West Street | 7.07 m | within the normal range for the date | 0 m |
| River Meon | |||
| East Meon | 0.075 m | -0.007 m | |
| Mislingford | 0.221 m | -0.007 m | |
| Titchfield | 0.912 m | within the normal range for the date | -0.027 m |
| Titchfield Canal | 1.976 m | -0.061 m | |
| West Meon | -0.096 m | 0 m | |
| Wickham | 18.622 m | -0.016 m | |
| River Wallington (Hampshire) | |||
| Denmead | 33.364 m | within the normal range for the date | -0.079 m |
| North Fareham weir | 0.24 m | -0.059 m | |
| West Brook (Emsworth) | |||
| Emsworth | 1.972 m | within the normal range for the date | -0.038 m |
Keep exploring
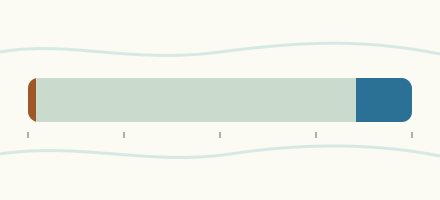 Country, United Kingdom Are the rivers and lakes in the United Kingdom unusually low or high? Every river and lake we follow here, against normal for the date.
 Today's list, United Kingdom Which places in the United Kingdom are furthest from normal today? The places in the United Kingdom furthest below and above normal today.
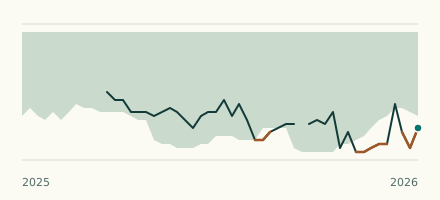 River gauge, United Kingdom Is the River Hamble unusually low at Hobb Lane? Level now, history, the same date in past years and each year's range.
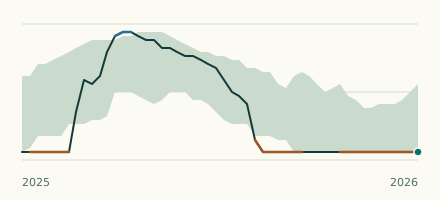 River gauge, United Kingdom Is the River Hamble unusually low at North Pond? Level now, history, the same date in past years and each year's range.