Derwent catchment river levels today
Are the rivers and lakes in the Derwent catchment unusually low or high?
We follow 42 water level gauges in the Derwent catchment. 5 gauges read below their normal range for the date and 1 gauge above it.
How many gauges do we follow in the Derwent catchment?
42 gauges of the 2,378 we follow in the United Kingdom, as of 21 November 2026.
How many waters in the Derwent catchment have a level gauge?
21 waters with a level gauge, of the 1,152 waters we follow in the United Kingdom, as of 21 November 2026.
How many gauges read below normal for the date?
5 gauges below their normal range, of the 33 gauges with a current reading and a normal range for the date, as of 21 November 2026.
How many gauges read above normal for the date?
1 gauge above its normal range, of the 33 gauges with a current reading and a normal range for the date, as of 21 November 2026.
How the places stand today
5 places below normal and 1 place above
Which places are furthest below normal?
Which places are furthest above normal?
Which gauges do we follow in Derwent?
| Place | Reading | Against normal for the date | Change in a day |
|---|---|---|---|
| Bielby Beck | |||
| Thornton Lock | 0.101 m | in the lowest 10 percent for the date | -0.007 m |
| Blackfoss Beck | |||
| Sandhill Bridge | 0.091 m | in the lowest 5 percent for the date | -0.003 m |
| Borough Beck | |||
| Helmsley High Street | 0.085 m | -0.005 m | |
| Brompton Beck (Scarborough) | |||
| Snainton Ings | 0.036 m | within the normal range for the date | -0.002 m |
| Costa Beck | |||
| Pickering Costa Beck | 0.127 m | 0 m | |
| Elvington Beck | |||
| Elvington Pumping Station | 3.954 m | within the normal range for the date | -0.056 m |
| Hodge Beck | |||
| Cherry Farm | 0.121 m | -0.04 m | |
| Hovingham Beck | |||
| Hovingham | 0.062 m | within the normal range for the date | -0.009 m |
| Levisham Beck | |||
| Levisham Mill | 0.053 m | within the normal range for the date | -0.002 m |
| Mill Beck (Norton) | |||
| Norton Mill Beck Screen | 0.701 m | in the highest 5 percent for the date | +0.01 m |
| Pickering Beck | |||
| Levisham Station | 0.36 m | within the normal range for the date | -0.126 m |
| Pickering | 0.162 m | within the normal range for the date | -0.083 m |
| Pickering Flood Alleviation Scheme | 0.543 m | -0.144 m | |
| Pickering, Ings Bridge | 0.112 m | within the normal range for the date | -0.039 m |
| Pocklington Beck | |||
| Pocklington | -0.009 m | within the normal range for the date | -0.001 m |
| Priorpot Beck | |||
| Norton Priorpot Beck PS | 0.156 m | +0.003 m | |
| River Derwent | |||
| Barmby | 2.089 m | within the normal range for the date | -0.223 m |
| Bubwith Bridge | 2.575 m | -0.414 m | |
| Buttercrambe | 0.253 m | +0.01 m | |
| Elvington Sluices | 5.742 m | +0.001 m | |
| Forge Valley | 0.317 m | -0.106 m | |
| Kirkham Sluices | 14.332 m | within the normal range for the date | +0.003 m |
| Loftsome Bridge | 2.071 m | within the normal range for the date | -0.296 m |
| Low Marishes | 2.375 m | within the normal range for the date | +0.046 m |
| Malton | 1.242 m | within the normal range for the date | -0.043 m |
| Malton, A64 Road Bridge | 1.321 m | within the normal range for the date | -0.09 m |
| Mowthorpe Weir Head | 41.579 m | within the normal range for the date | -0.314 m |
| Stamford Bridge | 7.225 m | within the normal range for the date | +0.004 m |
| West Ayton | 0.291 m | within the normal range for the date | -0.105 m |
| River Derwent (Durham) | |||
| Blackhall Mill | 0.10 m | in the lowest 10 percent for the date | -0.053 m |
| Rowlands Gill | 0.165 m | within the normal range for the date | -0.035 m |
| River Dove (North Yorkshire) | |||
| Kirkby Mills | 0.271 m | within the normal range for the date | -0.069 m |
| River Riccal | |||
| Nunnington | 0.193 m | within the normal range for the date | -0.01 m |
| River Rye | |||
| Broadway Foot | 0.095 m | in the lowest 10 percent for the date | -0.023 m |
| Howe Bridge | 1.386 m | within the normal range for the date | -0.205 m |
| Ness | 0.376 m | in the lowest 10 percent for the date | -0.056 m |
| River Seven | |||
| Normanby | 0.151 m | within the normal range for the date | -0.099 m |
| Sinnington | 0.243 m | within the normal range for the date | -0.087 m |
| Sea Cut | |||
| Mowthorpe | 0.585 m | within the normal range for the date | -0.509 m |
| Scalby | 0.451 m | within the normal range for the date | -0.226 m |
| Scarborough | 0.258 m | within the normal range for the date | -0.11 m |
| Thornton Beck | |||
| Thornton le Dale | 0.097 m | within the normal range for the date | -0.014 m |
Keep exploring
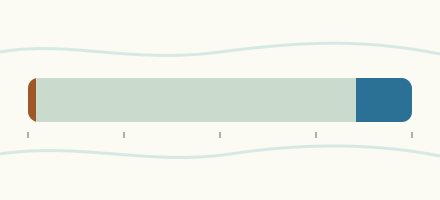 Country, United Kingdom Are the rivers and lakes in the United Kingdom unusually low or high? Every river and lake we follow here, against normal for the date.
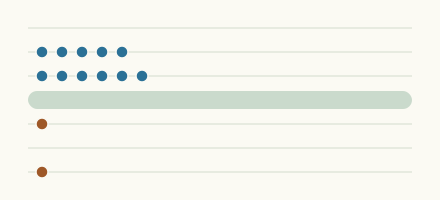 Today's list, United Kingdom Which places in the United Kingdom are furthest from normal today? The places in the United Kingdom furthest below and above normal today.
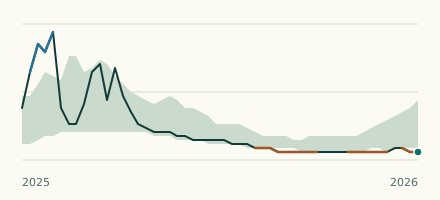 River gauge, United Kingdom Is the Blackfoss Beck unusually low at Sandhill Bridge? Level now, history, the same date in past years and each year's range.
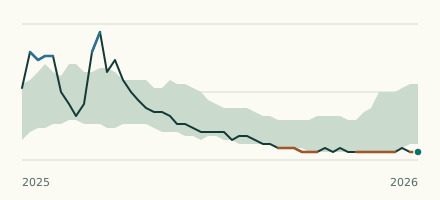 River gauge, United Kingdom Is the River Rye unusually low at Ness? Level now, history, the same date in past years and each year's range.