Cotswolds catchment river levels today
Are the rivers and lakes in the Cotswolds catchment unusually low or high?
We follow 35 water level gauges in the Cotswolds catchment. None read below their normal range for the date and 3 gauges above it.
How many gauges do we follow in the Cotswolds catchment?
35 gauges of the 2,378 we follow in the United Kingdom, as of 21 November 2026.
How many waters in the Cotswolds catchment have a level gauge?
14 waters with a level gauge, of the 1,152 waters we follow in the United Kingdom, as of 21 November 2026.
How many gauges read below normal for the date?
0 gauges below their normal range, of the 26 gauges with a current reading and a normal range for the date, as of 21 November 2026.
How many gauges read above normal for the date?
3 gauges above their normal range, of the 26 gauges with a current reading and a normal range for the date, as of 21 November 2026.
How the places stand today
0 places below normal and 3 places above
Which places are furthest above normal?
Which gauges do we follow in Cotswolds?
| Place | Reading | Against normal for the date | Change in a day |
|---|---|---|---|
| Ampney Brook | |||
| Ampney St Peter | 0.234 m | within the normal range for the date | +0.005 m |
| Sheeppen Bridge | 0.682 m | -0.204 m | |
| Clanfield Brook | |||
| Clanfield | 0.986 m | in the highest 5 percent for the date | -0.062 m |
| Marston Meysey Brook | |||
| Whetstone Bridge | 0.658 m | in the highest 10 percent for the date | -0.15 m |
| River Churn | |||
| Cerney Wick | 0.193 m | within the normal range for the date | -0.063 m |
| Cirencester | 0.11 m | within the normal range for the date | -0.008 m |
| South Cerney | 0.442 m | within the normal range for the date | -0.052 m |
| River Coln | |||
| Bibury | 0.073 m | within the normal range for the date | +0.006 m |
| Fairford | 0.478 m | within the normal range for the date | +0.002 m |
| Fosse Bridge | 0.032 m | -0.003 m | |
| River Dikler | |||
| Bourton Dickler | 0.118 m | -0.003 m | |
| River Evenlode | |||
| Cassington Weir A | 0.289 m | within the normal range for the date | +0.003 m |
| Cassington Weir B | 0.352 m | within the normal range for the date | +0.003 m |
| Evenlode Bridge | 0.682 m | within the normal range for the date | -0.138 m |
| Moreton | 0.202 m | within the normal range for the date | -0.025 m |
| Shipton | 0.913 m | within the normal range for the date | -0.126 m |
| River Glyme | |||
| Woodstock | 0.117 m | within the normal range for the date | -0.108 m |
| River Leach | |||
| Lechlade | 0.131 m | within the normal range for the date | -0.016 m |
| River Thames | |||
| Buscot Lock | 0.222 m | in the highest 10 percent for the date | -0.076 m |
| Cricklade | 0.642 m | within the normal range for the date | -0.017 m |
| Ewen | 0.109 m | -0.003 m | |
| Farmoor | 1.02 m | within the normal range for the date | -0.069 m |
| Hannington Bridge | 3.395 m | within the normal range for the date | -0.221 m |
| Northmoor Lock | 0.117 m | within the normal range for the date | -0.098 m |
| Pinkhill Lock | 0.235 m | within the normal range for the date | -0.075 m |
| Rushey Lock | 0.115 m | within the normal range for the date | -0.092 m |
| Somerford Keynes | 0.96 m | within the normal range for the date | -0.042 m |
| St Johns Lock | 0.159 m | within the normal range for the date | -0.056 m |
| River Windrush | |||
| Bourton Windrush | 0.099 m | -0.003 m | |
| Newbridge GS | 3.627 m | -0.036 m | |
| Witney | 0.658 m | within the normal range for the date | -0.068 m |
| Worsham | 0.394 m | -0.057 m | |
| Shill Brook | |||
| Bampton | 1.009 m | within the normal range for the date | -0.101 m |
| South Marston Brook | |||
| Highworth Bridge | 0.181 m | -0.088 m | |
| Swill Brook | |||
| Oaksey | 1.412 m | -0.078 m | |
Keep exploring
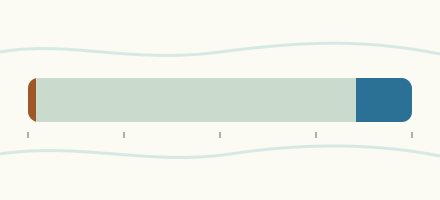 Country, United Kingdom Are the rivers and lakes in the United Kingdom unusually low or high? Every river and lake we follow here, against normal for the date.
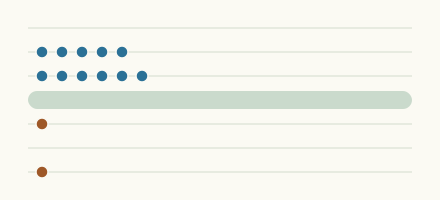 Today's list, United Kingdom Which places in the United Kingdom are furthest from normal today? The places in the United Kingdom furthest below and above normal today.
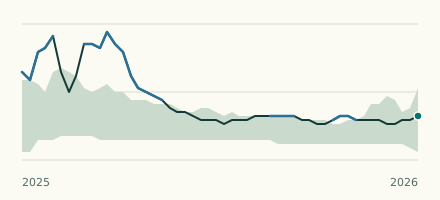 River gauge, United Kingdom Is the Clanfield Brook unusually high at Clanfield? Level now, history, the same date in past years and each year's range.
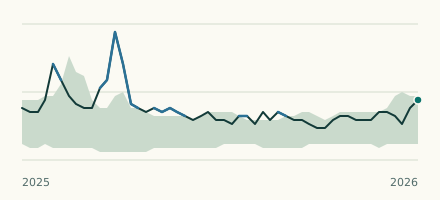 River gauge, United Kingdom Is the River Thames unusually high at Buscot Lock? Level now, history, the same date in past years and each year's range.