Cam and Ely Ouse (Including South Level) catchment river levels today
Are the rivers and lakes in the Cam and Ely Ouse (Including South Level) catchment unusually low or high?
We follow 37 water level gauges in the Cam and Ely Ouse (Including South Level) catchment.
How many gauges do we follow in the Cam and Ely Ouse (Including South Level) catchment?
37 gauges of the 2,378 we follow in the United Kingdom, as of 21 November 2026.
How many waters in the Cam and Ely Ouse (Including South Level) catchment have a level gauge?
18 waters with a level gauge, of the 1,152 waters we follow in the United Kingdom, as of 21 November 2026.
How many gauges read below normal for the date?
5 gauges below their normal range, of the 19 gauges with a current reading and a normal range for the date, as of 21 November 2026.
How many gauges read above normal for the date?
0 gauges above their normal range, of the 19 gauges with a current reading and a normal range for the date, as of 21 November 2026.
How the places stand today
5 places below normal and 0 places above
Which places are furthest below normal?
Which gauges do we follow in Cam and Ely Ouse (Including South Level)?
| Place | Reading | Against normal for the date | Change in a day |
|---|---|---|---|
| Bin Brook | |||
| Bin Brook | 0.228 m | -0.036 m | |
| Bourn Brook | |||
| Bourn Brook | 0.297 m | -0.018 m | |
| Comberton | 0.377 m | -0.124 m | |
| Oakington Brook | |||
| Oakington | 0.268 m | -0.016 m | |
| Quy Water | |||
| Lode | 0.098 m | within the normal range for the date | -0.022 m |
| River Cam | |||
| Cambridge Baits Bite | 0.255 m | +0.003 m | |
| Cambridge Jesus Lock | 0.73 m | -0.004 m | |
| Dernford | 0.099 m | within the normal range for the date | -0.014 m |
| Great Chesterford | 0.147 m | within the normal range for the date | -0.006 m |
| River Granta | |||
| Babraham | 0.05 m | in the lowest 10 percent for the date | -0.012 m |
| Linton | 0.052 m | within the normal range for the date | -0.002 m |
| Stapleford | 0.029 m | in the lowest 10 percent for the date | -0.023 m |
| River Great Ouse | |||
| Ely | 0.615 m | -0.042 m | |
| Soham Lode | 1.585 m | within the normal range for the date | -0.048 m |
| River Kennett | |||
| Beck Bridge | -0.196 m | lower than any day of these dates in 64 years | 0 m |
| Ousden | 0.231 m | 0 m | |
| River Lark | |||
| Barton Mills Sluice | 0.13 m | -0.007 m | |
| Fornham St Martin | 0.05 m | within the normal range for the date | -0.006 m |
| Isleham | 2.101 m | within the normal range for the date | -0.013 m |
| Sicklesmere | 0.244 m | -0.007 m | |
| Temple | 0.238 m | within the normal range for the date | -0.027 m |
| River Little Ouse | |||
| Abbey Heath | 0.12 m | in the lowest 5 percent for the date | +0.001 m |
| Knettishall | 0.20 m | within the normal range for the date | -0.033 m |
| Little Ouse | 1.639 m | -0.026 m | |
| River Nar | |||
| Setchey Bridge | 0.417 m | -0.026 m | |
| River Rhee | |||
| Cambridge Byron's Pool | 0.429 m | -0.005 m | |
| Haslingfield Burnt Mill | 0.106 m | within the normal range for the date | -0.003 m |
| Wimpole | 0.08 m | -0.009 m | |
| River Snail | |||
| Fordham | 0.097 m | in the lowest 5 percent for the date | -0.005 m |
| River Thet | |||
| Bridgham | 0.158 m | within the normal range for the date | -0.003 m |
| Melford | 0.131 m | +0.003 m | |
| Redbridge | 0.306 m | within the normal range for the date | -0.075 m |
| Thetford Coffee Mill Sluice | 0.564 m | +0.006 m | |
| River Whittle | |||
| Quidenham | 0.072 m | within the normal range for the date | -0.013 m |
| River Wissey | |||
| Wissey Sluice | 1.687 m | within the normal range for the date | -0.059 m |
| Washpit Brook | |||
| Girton | 0.853 m | -0.054 m | |
| Whaddon Brook (Cambridgeshire) | |||
| Whaddon | 0.509 m | -0.01 m | |
Keep exploring
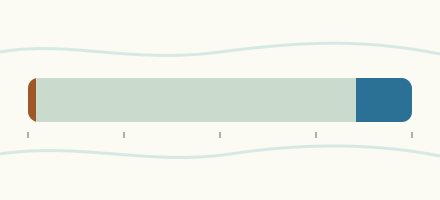 Country, United Kingdom Are the rivers and lakes in the United Kingdom unusually low or high? Every river and lake we follow here, against normal for the date.
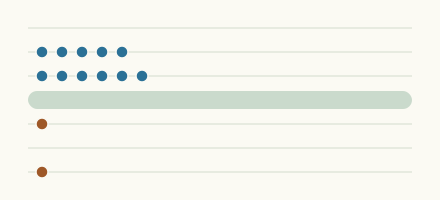 Today's list, United Kingdom Which places in the United Kingdom are furthest from normal today? The places in the United Kingdom furthest below and above normal today.
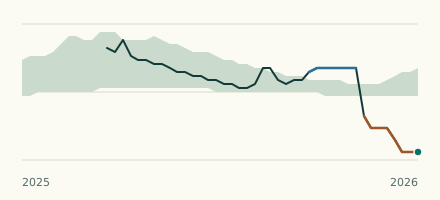 River gauge, United Kingdom Is the River Kennett unusually low at Beck Bridge? Level now, history, the same date in past years and each year's range.
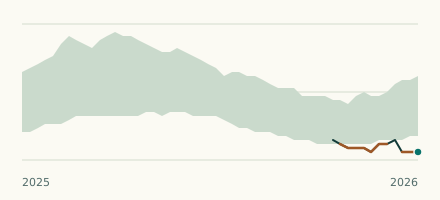 River gauge, United Kingdom Is the River Snail unusually low at Fordham? Level now, history, the same date in past years and each year's range.