Magdeburg waterway office river levels today
Are the rivers and lakes in the Magdeburg waterway office unusually low or high?
We follow 38 water level gauges in the Magdeburg waterway office. 16 gauges read below their normal range for the date and none above it.
How many gauges do we follow in the Magdeburg waterway office?
38 gauges of the 1,158 we follow in Germany, as of 21 November 2026.
How many waters in the Magdeburg waterway office have a level gauge?
5 waters with a level gauge, of the 363 waters we follow in Germany, as of 21 November 2026.
How many gauges read below normal for the date?
16 gauges below their normal range, of the 36 gauges with a current reading and a normal range for the date, as of 21 November 2026.
How many gauges read above normal for the date?
0 gauges above their normal range, of the 36 gauges with a current reading and a normal range for the date, as of 21 November 2026.
How the places stand today
16 places below normal and 0 places above
Which places are furthest below normal?
More places
Which gauges do we follow in Magdeburg?
| Place | Reading | Against normal for the date | Change in a day |
|---|---|---|---|
| Elbe | |||
| Barbykm 294.82 | 64 cm | in the lowest 5 percent for the date | +9 cm |
| Gorlebenkm 492.95 | 74 cm | in the lowest 5 percent for the date | -9 cm |
| Lenzenkm 484.7 | 85 cm | ||
| Magdeburg-Buckaukm 325.39 | 111 cm | in the lowest 5 percent for the date | +8 cm |
| Magdeburg-Strombrückekm 326.67 | 60 cm | in the lowest 5 percent for the date | -1 cm |
| Müggendorfkm 463.94 | 107 cm | in the lowest 5 percent for the date | -15 cm |
| Niegripp APkm 343.6 | 212 cm | in the lowest 5 percent for the date | +12 cm |
| Rogätzkm 350.64 | 28 cm | in the lowest 5 percent for the date | +11 cm |
| Rothenseekm 333.12 | 103 cm | in the lowest 5 percent for the date | +13 cm |
| Sandaukm 416.06 | 168 cm | in the lowest 5 percent for the date | +3 cm |
| Scharleukkm 447.22 | 115 cm | in the lowest 5 percent for the date | +2 cm |
| Schnackenburgkm 474.56 | 95 cm | in the lowest 5 percent for the date | -16 cm |
| Schönebeckkm 311.76 | 100 cm | in the lowest 5 percent for the date | +8 cm |
| Storkaukm 396.11 | 173 cm | in the lowest 5 percent for the date | +4 cm |
| Tangermündekm 388.26 | 130 cm | in the lowest 5 percent for the date | +5 cm |
| Wittenbergekm 453.98 | 96 cm | in the lowest 5 percent for the date | |
| Mittelland Canal | |||
| Kanalbrückekm 321.33 | 5,601 cm | within the normal range for the date | -6 cm |
| Velsdorfkm 283.1 | 5,613 cm | ||
| Niegripper Verbindungskanal | |||
| Niegripp BPkm 0.59 | 306 cm | within the normal range for the date | +2 cm |
| Rothenseer Verbindungskanal | |||
| Magdeburg-RO NWSkm 4.15 | 355 cm | within the normal range for the date | +4 cm |
| Schleuse Rothensee UPkm 1.3 | 427 cm | within the normal range for the date | +8 cm |
| Saale | |||
| Alsleben OPkm 50.42 | 236 cm | within the normal range for the date | +11 cm |
| Alsleben UPkm 50.24 | 125 cm | within the normal range for the date | 0 cm |
| Bernburg OPkm 36.2 | 477 cm | in the lowest 5 percent for the date | -1 cm |
| Bernburg UPkm 36.05 | 125 cm | within the normal range for the date | +5 cm |
| Calbe Grizehnekm 17.43 | 223 cm | within the normal range for the date | +13 cm |
| Calbe OPkm 20.08 | 351 cm | within the normal range for the date | -4 cm |
| Calbe UPkm 19.67 | 364 cm | within the normal range for the date | +2 cm |
| Gross Rosenburgkm 9.64 | 160 cm | within the normal range for the date | +12 cm |
| Nienburg (Saale)km 27.9 | 139 cm | within the normal range for the date | 0 cm |
| Rischmühle UPkm 115.19 | 214 cm | within the normal range for the date | +8 cm |
| Rothenburg OPkm 58.78 | 333 cm | within the normal range for the date | +3 cm |
| Rothenburg UPkm 58.6 | 344 cm | within the normal range for the date | +15 cm |
| Röpzigkm 101.9 | 58 cm | within the normal range for the date | +8 cm |
| Trotha OPkm 89.22 | 247 cm | within the normal range for the date | +6 cm |
| Trotha UPkm 89.15 | 181 cm | within the normal range for the date | +13 cm |
| Wettin OPkm 70.47 | 358 cm | within the normal range for the date | +3 cm |
| Wettin UPkm 70.3 | 347 cm | within the normal range for the date | +14 cm |
Keep exploring
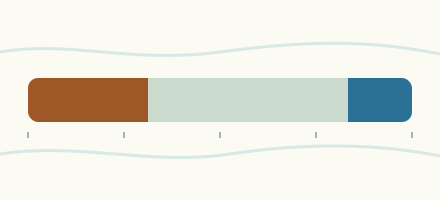 Country, Germany Are the rivers and lakes in Germany unusually low or high? Every river and lake we follow in Germany, against normal for the date.
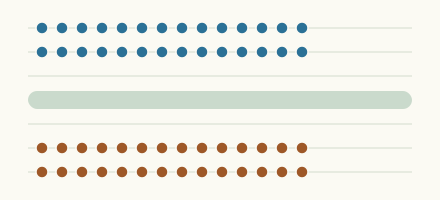 Today's list, Germany Which places in Germany are furthest from normal today? The places in Germany furthest below and above normal today.
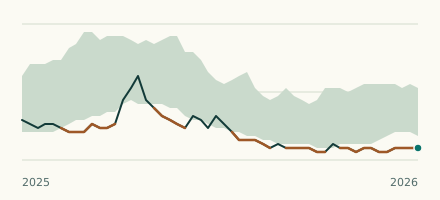 River gauge, Germany Is the Elbe unusually low at Schnackenburg? Level now, history, the same date in past years and each year's range.
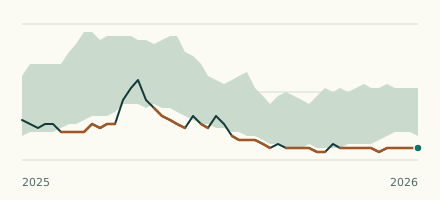 River gauge, Germany Is the Elbe unusually low at Müggendorf? Level now, history, the same date in past years and each year's range.