Koblenz waterway office river levels today
Are the rivers and lakes in the Koblenz waterway office unusually low or high?
We follow 37 water level gauges in the Koblenz waterway office. 2 gauges read below their normal range for the date and 12 gauges above it.
How many gauges do we follow in the Koblenz waterway office?
37 gauges of the 1,158 we follow in Germany, as of 21 November 2026.
How many waters in the Koblenz waterway office have a level gauge?
2 waters with a level gauge, of the 363 waters we follow in Germany, as of 21 November 2026.
How many gauges read below normal for the date?
2 gauges below their normal range, of the 20 gauges with a current reading and a normal range for the date, as of 21 November 2026.
How many gauges read above normal for the date?
12 gauges above their normal range, of the 20 gauges with a current reading and a normal range for the date, as of 21 November 2026.
How the places stand today
2 places below normal and 12 places above
Which places are furthest below normal?
Which places are furthest above normal?
More places
Which gauges do we follow in Koblenz?
| Place | Reading | Against normal for the date | Change in a day |
|---|---|---|---|
| Lahn | |||
| Bad Ems Schleuse UPkm 127 | 218 cm | higher than any day of these dates in 26 years | +22 cm |
| Bad Ems Wehr OPkm 125.9 | 444 cm | in the highest 10 percent for the date | +20 cm |
| Cramberg Schleuse OPkm 91.8 | 713 cm | in the highest 5 percent for the date | +12 cm |
| Cramberg Schleuse UPkm 91.8 | 323 cm | in the highest 10 percent for the date | +69 cm |
| Dausenau Schleuse OPkm 122.3 | 614 cm | in the highest 10 percent for the date | +4 cm |
| Dausenau Schleuse UPkm 122.4 | 387 cm | in the highest 5 percent for the date | +59 cm |
| Diez Hafenkm 83.7 | 252 cm | in the highest 5 percent for the date | +61 cm |
| Diez Schleuse OPkm 83.2 | 560 cm | +8 cm | |
| Diez Schleuse UPkm 83.2 | 382 cm | +62 cm | |
| Fürfurt Schleuse UPkm 51.2 | 325 cm | +72 cm | |
| Giessen Klärwerkkm -3.2 | 474 cm | in the highest 5 percent for the date | +107 cm |
| Hollerich Schleuse OPkm 113 | 662 cm | -17 cm | |
| Hollerich Schleuse UPkm 113.1 | 286 cm | +57 cm | |
| Kalkofen Neukm 106.4 | 354 cm | in the highest 5 percent for the date | +59 cm |
| Kalkofen Schleuse OPkm 105.6 | 695 cm | -5 cm | |
| Lahnstein Schleuse OPkm 135.9 | 683 cm | +2 cm | |
| Lahnstein Schleuse UPkm 136 | 226 cm | within the normal range for the date | +48 cm |
| Leun Neukm 25.1 | 385 cm | in the highest 5 percent for the date | +83 cm |
| Limburg Schleuse UPkm 76.6 | 230 cm | in the highest 5 percent for the date | +67 cm |
| Nassau Schleuse OPkm 117.6 | 587 cm | +1 cm | |
| Nassau Schleuse UPkm 117.643 | 396 cm | +75 cm | |
| Niederbiel Schleuse Kanal OPkm 19.3 | 457 cm | +33 cm | |
| Runkel Schleuse UPkm 65.3 | 281 cm | +75 cm | |
| Scheidt Schleuse OPkm 96.8 | 669 cm | +34 cm | |
| Scheidt Schleuse UPkm 96.8 | 426 cm | +59 cm | |
| Moselle | |||
| Cochemkm 51.6 | 352 cm | within the normal range for the date | +41 cm |
| Enkirch OPkm 103.128 | 953 cm | +2 cm | |
| Enkirch UPkm 102.6 | 490 cm | within the normal range for the date | +74 cm |
| Fankel OPkm 59.7 | 897 cm | lower than any day of these dates in 20 years | -4 cm |
| Fankel UPkm 58.9 | 474 cm | within the normal range for the date | +60 cm |
| Koblenz OPkm 2.111 | 196 cm | in the lowest 5 percent for the date | -5 cm |
| Lehmen OPkm 21.04 | 947 cm | +1 cm | |
| Lehmen UPkm 20.37 | 401 cm | within the normal range for the date | +41 cm |
| Müden OPkm 37.47 | 849 cm | +1 cm | |
| Müden UPkm 36.8 | 416 cm | within the normal range for the date | +47 cm |
| Sankt Aldegund OPkm 78.48 | 898 cm | -2 cm | |
| Sankt Aldegund UPkm 78.1 | 480 cm | in the highest 10 percent for the date | +64 cm |
Keep exploring
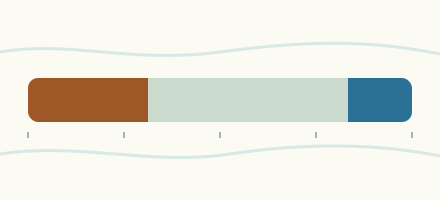 Country, Germany Are the rivers and lakes in Germany unusually low or high? Every river and lake we follow in Germany, against normal for the date.
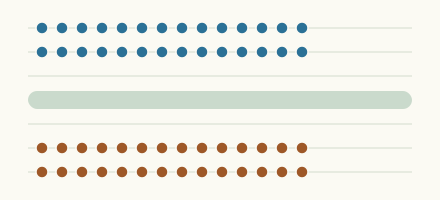 Today's list, Germany Which places in Germany are furthest from normal today? The places in Germany furthest below and above normal today.
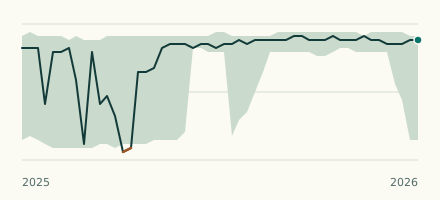 River gauge, Germany Is the Moselle unusually low at Fankel OP? Level now, history, the same date in past years and each year's range.
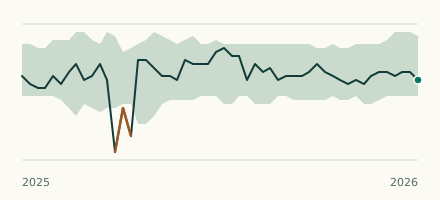 River gauge, Germany Is the Moselle unusually low at Koblenz OP? Level now, history, the same date in past years and each year's range.