Eberswalde waterway office river levels today
Are the rivers and lakes in the Eberswalde waterway office unusually low or high?
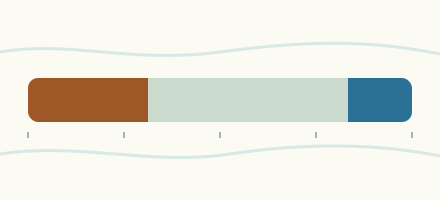
We follow 65 water level gauges in the Eberswalde waterway office. 15 gauges read below their normal range for the date and 8 gauges above it.
How many gauges do we follow in the Eberswalde waterway office?
65 gauges of the 1,158 we follow in Germany, as of 21 November 2026.
How many waters in the Eberswalde waterway office have a level gauge?
16 waters with a level gauge, of the 363 waters we follow in Germany, as of 21 November 2026.
How many gauges read below normal for the date?
15 gauges below their normal range, of the 58 gauges with a current reading and a normal range for the date, as of 21 November 2026.
How many gauges read above normal for the date?
8 gauges above their normal range, of the 58 gauges with a current reading and a normal range for the date, as of 21 November 2026.
How the places stand today
15 places below normal and 8 places above
Which places are furthest below normal?
More places
Which places are furthest above normal?
More places
Which gauges do we follow in Eberswalde?
| Place | Reading | Against normal for the date | Change in a day |
|---|---|---|---|
| Finow Canal | |||
| Eberswalde OPkm 77.9 | 417 cm | in the highest 5 percent for the date | +4 cm |
| Grafenbrück OPkm 63.3 | 442 cm | within the normal range for the date | 0 cm |
| Leesenbrück OPkm 61.1 | 319 cm | within the normal range for the date | +1 cm |
| Liepe OPkm 88.9 | 280 cm | in the highest 5 percent for the date | +9 cm |
| Liepe UPkm 88.9 | 43 cm | lower than any day of these dates in 16 years | -7 cm |
| Ragöse OPkm 81 | 323 cm | in the highest 5 percent for the date | +12 cm |
| Ruhlsdorf OPkm 59.2 | 287 cm | within the normal range for the date | -1 cm |
| Stecher OPkm 84.4 | 596 cm | within the normal range for the date | +1 cm |
| Havel-Oder Waterway | |||
| Borgsdorfkm 20.3 | 253 cm | within the normal range for the date | -1 cm |
| Friedrichsthalkm 133.7 | 534 cm | within the normal range for the date | -14 cm |
| Hohensaaten West APkm 93 | 121 cm | within the normal range for the date | -18 cm |
| Hohensaaten West BPkm 92.7 | 195 cm | lower than any day of these dates in 26 years | -5 cm |
| Lehnitz OPkm 28.7 | 843 cm | within the normal range for the date | -3 cm |
| Lehnitz UPkm 28.4 | 253 cm | within the normal range for the date | 0 cm |
| Niederfinow SHW OPkm 77.4 | 845 cm | in the highest 10 percent for the date | +1 cm |
| Niederfinow SHW UPkm 78 | 44 cm | in the lowest 5 percent for the date | -6 cm |
| Schwedt Schleuse BPkm 123.5 | 535 cm | within the normal range for the date | -16 cm |
| Lychener Gewässer | |||
| Himmelpfort OPkm 0.3 | 177 cm | within the normal range for the date | +1 cm |
| Himmelpfort UPkm 0.2 | 54 cm | within the normal range for the date | 0 cm |
| Malzer Kanal | |||
| Liebenwalde OPkm 45.3 | 304 cm | in the highest 5 percent for the date | +4 cm |
| Liebenwalde UPkm 43.3 | 130 cm | in the highest 10 percent for the date | -1 cm |
| Müritz-Havel Waterway | |||
| Diemitz OPkm 13.7 | 206 cm | 0 cm | |
| Diemitz UPkm 13.7 | 132 cm | 0 cm | |
| Mirow OPkm 23.1 | 173 cm | ||
| Mirow UPkm 22.9 | 130 cm | within the normal range for the date | -1 cm |
| Strasen OPkm 2.7 | 176 cm | 0 cm | |
| Strasen UPkm 2.7 | 132 cm | 0 cm | |
| Oder | |||
| Eisenhüttenstadtkm 554.1 | 188 cm | within the normal range for the date | +8 cm |
| Frankfurt1 (Oder)km 585.3 | 120 cm | in the lowest 10 percent for the date | -3 cm |
| Hohensaaten-Finowkm 665 | 219 cm | in the lowest 10 percent for the date | +5 cm |
| Kienitzkm 632.9 | 218 cm | in the lowest 10 percent for the date | +4 cm |
| Kietzkm 614.8 | 197 cm | in the lowest 10 percent for the date | +2 cm |
| Ratzdorfkm 542.5 | 179 cm | in the lowest 10 percent for the date | +10 cm |
| Schwedt-Oderbrückekm 690.6 | 545 cm | within the normal range for the date | -15 cm |
| Stützkowkm 680.6 | 573 cm | within the normal range for the date | -10 cm |
| Oranienburg Canal | |||
| Sachsenhausen OPkm 29.8 | 188 cm | within the normal range for the date | -1 cm |
| Sachsenhausen UPkm 29.8 | 142 cm | within the normal range for the date | -4 cm |
| Oranienburger Havel | |||
| OHV Km 1.467 (Blaues Wunder)km 1.5 | 66 cm | within the normal range for the date | 0 cm |
| OHV Km 3.014 (Hochspannung)km 3 | 65 cm | in the lowest 10 percent for the date | 0 cm |
| Rheinsberger Gewässer | |||
| Wolfsbruch OPkm 2.3 | 228 cm | within the normal range for the date | -1 cm |
| Wolfsbruch UPkm 2.5 | 165 cm | in the lowest 5 percent for the date | 0 cm |
| Schwedter Querfahrt | |||
| Schwedt Schleuse APkm 0.5 | 536 cm | within the normal range for the date | -16 cm |
| Templiner Gewässer | |||
| Kannenburg OPkm 3.6 | 223 cm | within the normal range for the date | 0 cm |
| Kannenburg UPkm 3.6 | 55 cm | lower than any day of these dates in 16 years | -3 cm |
| Templin OPkm 13.3 | 481 cm | within the normal range for the date | -1 cm |
| Templin UPkm 13.3 | 55 cm | in the highest 5 percent for the date | +1 cm |
| Upper Havel Waterway | |||
| Bischofswerder OPkm 4.5 | 470 cm | within the normal range for the date | +6 cm |
| Bischofswerder UPkm 4.2 | 132 cm | within the normal range for the date | +4 cm |
| Bredereiche OPkm 48 | 506 cm | within the normal range for the date | 0 cm |
| Bredereiche UPkm 47.6 | 211 cm | within the normal range for the date | -2 cm |
| Fürstenberg OPkm 60.8 | 186 cm | within the normal range for the date | -1 cm |
| Fürstenberg UPkm 60.7 | 135 cm | within the normal range for the date | +1 cm |
| Vosswinkel OPkm 88.1 | 217 cm | 0 cm | |
| Vosswinkel UPkm 90 | 134 cm | 0 cm | |
| Wesenberg OPkm 81.8 | 220 cm | lower than any day of these dates in 16 years | 0 cm |
| Wesenberg UPkm 81.7 | 226 cm | in the lowest 5 percent for the date | 0 cm |
| Zehdenick OPkm 16.1 | 447 cm | within the normal range for the date | -1 cm |
| Zehdenick UPkm 15.8 | 129 cm | within the normal range for the date | +6 cm |
| Verbindungskanal Hohensaaten | |||
| Hohensaaten Ost APkm 92.9 | 285 cm | in the lowest 10 percent for the date | +4 cm |
| Wentow-Gewässer | |||
| Marienthal OPkm 0.1 | 295 cm | higher than any day of these dates in 17 years | +15 cm |
| Marienthal UPkm 0.1 | 83 cm | in the lowest 10 percent for the date | -3 cm |
| Werbelliner Gewässer | |||
| Eichhorst OPkm 8.7 | 391 cm | within the normal range for the date | 0 cm |
| Eichhorst UPkm 8.7 | 107 cm | within the normal range for the date | 0 cm |
| West Oder | |||
| Gartzkm 8 | 534 cm | within the normal range for the date | -15 cm |
| Mescherinkm 14.1 | 534 cm | within the normal range for the date | -16 cm |
Keep exploring
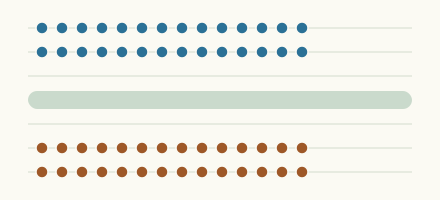
 Country, Germany Are the rivers and lakes in Germany unusually low or high? Every river and lake we follow in Germany, against normal for the date.
 Today's list, Germany Which places in Germany are furthest from normal today? The places in Germany furthest below and above normal today.
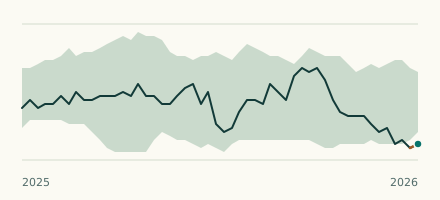 Waterway gauge, Germany Is the Havel-Oder Waterway unusually low at Hohensaaten West BP? Level now, history, the same date in past years and each year's range.
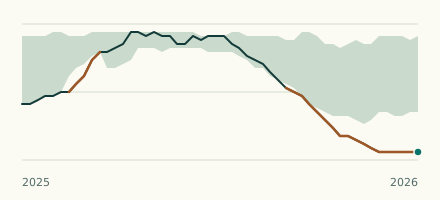 Waterway gauge, Germany Is the Upper Havel Waterway unusually low at Wesenberg OP? Level now, history, the same date in past years and each year's range.