Dresden waterway office river levels today
Are the rivers and lakes in the Dresden waterway office unusually low or high?
We follow 16 water level gauges in the Dresden waterway office. 8 gauges read below their normal range for the date and none above it.
How many gauges do we follow in the Dresden waterway office?
16 gauges of the 1,158 we follow in Germany, as of 21 November 2026.
How many waters in the Dresden waterway office have a level gauge?
2 waters with a level gauge, of the 363 waters we follow in Germany, as of 21 November 2026.
How many gauges read below normal for the date?
8 gauges below their normal range, of the 16 gauges with a current reading and a normal range for the date, as of 21 November 2026.
How many gauges read above normal for the date?
0 gauges above their normal range, of the 16 gauges with a current reading and a normal range for the date, as of 21 November 2026.
How the places stand today
8 places below normal and 0 places above
Which places are furthest below normal?
Which gauges do we follow in Dresden?
| Place | Reading | Against normal for the date | Change in a day |
|---|---|---|---|
| Elbe | |||
| Akenkm 274.8 | 69 cm | in the lowest 5 percent for the date | +8 cm |
| Coswigkm 236.31 | 127 cm | in the lowest 5 percent for the date | +14 cm |
| Dessaukm 261.16 | 84 cm | in the lowest 10 percent for the date | +11 cm |
| Dresdenkm 55.63 | 115 cm | within the normal range for the date | +6 cm |
| Elsterkm 200.15 | 48 cm | in the lowest 5 percent for the date | +5 cm |
| Meissenkm 82.2 | 170 cm | within the normal range for the date | +24 cm |
| Mühlbergkm 128.02 | 206 cm | within the normal range for the date | +35 cm |
| Pirnakm 34.67 | 159 cm | within the normal range for the date | +1 cm |
| Pretzsch-Maukenkm 184.45 | 54 cm | in the lowest 5 percent for the date | +9 cm |
| Riesakm 108.4 | 182 cm | within the normal range for the date | +34 cm |
| Rosslaukm 257.84 | 64 cm | in the lowest 10 percent for the date | +14 cm |
| Schönakm 2.05 | 151 cm | within the normal range for the date | +17 cm |
| Torgaukm 154.15 | 99 cm | within the normal range for the date | +22 cm |
| Vockerodekm 245.62 | 94 cm | in the lowest 5 percent for the date | +15 cm |
| Wittenbergkm 214.14 | 100 cm | in the lowest 5 percent for the date | +11 cm |
| Saale | |||
| Rischmühle OPkm 115.26 | 277 cm | within the normal range for the date | +5 cm |
Keep exploring
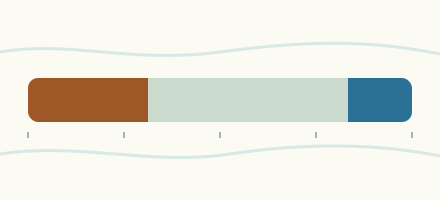 Country, Germany Are the rivers and lakes in Germany unusually low or high? Every river and lake we follow in Germany, against normal for the date.
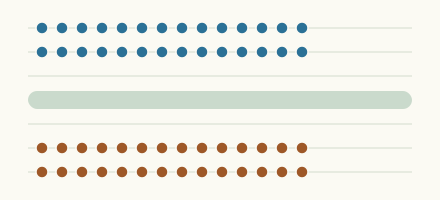 Today's list, Germany Which places in Germany are furthest from normal today? The places in Germany furthest below and above normal today.
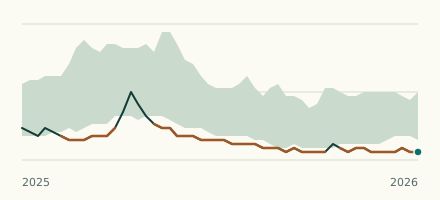 River gauge, Germany Is the Elbe unusually low at Coswig? Level now, history, the same date in past years and each year's range.
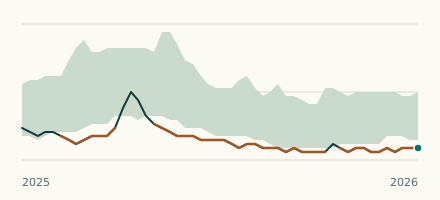 River gauge, Germany Is the Elbe unusually low at Vockerode? Level now, history, the same date in past years and each year's range.