Brandenburg waterway office river levels today
Are the rivers and lakes in the Brandenburg waterway office unusually low or high?
We follow 41 water level gauges in the Brandenburg waterway office. 4 gauges read below their normal range for the date and 4 gauges above it.
How many gauges do we follow in the Brandenburg waterway office?
41 gauges of the 1,158 we follow in Germany, as of 21 November 2026.
How many waters in the Brandenburg waterway office have a level gauge?
5 waters with a level gauge, of the 363 waters we follow in Germany, as of 21 November 2026.
How many gauges read below normal for the date?
4 gauges below their normal range, of the 39 gauges with a current reading and a normal range for the date, as of 21 November 2026.
How many gauges read above normal for the date?
4 gauges above their normal range, of the 39 gauges with a current reading and a normal range for the date, as of 21 November 2026.
How the places stand today
4 places below normal and 4 places above
Which places are furthest below normal?
Which places are furthest above normal?
Which gauges do we follow in Brandenburg?
| Place | Reading | Against normal for the date | Change in a day |
|---|---|---|---|
| Elbe-Havel Canal | |||
| Burgkm 332.54 | 300 cm | within the normal range for the date | -5 cm |
| Detershagenkm 326.83 | 303 cm | within the normal range for the date | -2 cm |
| Genthinkm 361.444 | 304 cm | within the normal range for the date | -3 cm |
| Kadekm 371.285 | 305 cm | within the normal range for the date | -3 cm |
| Rossdorfkm 368.45 | 162 cm | -4 cm | |
| Schlagenthiner Stremmekm 363.71 | 130 cm | -2 cm | |
| Wusterwitz OPkm 376.56 | 309 cm | in the highest 5 percent for the date | 0 cm |
| Wusterwitz UPkm 376.965 | 298 cm | within the normal range for the date | +3 cm |
| Zerben OPkm 344.686 | 297 cm | within the normal range for the date | -7 cm |
| Zerben UPkm 346.162 | 301 cm | within the normal range for the date | -9 cm |
| Havel Canal | |||
| Schönwalde OPkm 8.676 | 346 cm | within the normal range for the date | -2 cm |
| Schönwalde UPkm 9.002 | 138 cm | within the normal range for the date | +1 cm |
| Lower Havel Waterway | |||
| Albertsheimkm 109.83 | 112 cm | within the normal range for the date | +2 cm |
| Bahnitz OPkm 81.793 | 221 cm | within the normal range for the date | +4 cm |
| Bahnitz UPkm 82.11 | 142 cm | within the normal range for the date | +8 cm |
| Brandenburg OPkm 55.115 | 217 cm | within the normal range for the date | -4 cm |
| Brandenburg UPkm 56 | 109 cm | within the normal range for the date | +5 cm |
| Garz OPkm 128.845 | 237 cm | within the normal range for the date | 0 cm |
| Garz UPkm 129.18 | 167 cm | within the normal range for the date | +10 cm |
| Gnevsdorf EPkm 165.48 | 122 cm | in the lowest 5 percent for the date | +21 cm |
| Gnevsdorf OPkm 165.45 | 315 cm | within the normal range for the date | +8 cm |
| Grütz OPkm 116.772 | 179 cm | within the normal range for the date | 0 cm |
| Grütz UPkm 117.238 | 75 cm | within the normal range for the date | +2 cm |
| Gülpe OPkm 127.644 | 220 cm | within the normal range for the date | +3 cm |
| Havelberg EPkm 147.305 | 136 cm | lower than any day of these dates in 26 years | +3 cm |
| Havelberg Stadtkm 145.261 | 223 cm | within the normal range for the date | +7 cm |
| Havelberg UPkm 146.89 | 222 cm | within the normal range for the date | +7 cm |
| Ketzinkm 34.053 | 94 cm | within the normal range for the date | -1 cm |
| Neuwerben EPkm 156.21 | 165 cm | lower than any day of these dates in 26 years | +3 cm |
| Plaue OPkm 67.8 | 67 cm | within the normal range for the date | -10 cm |
| Plaue UPkm 68 | 180 cm | within the normal range for the date | +4 cm |
| Quitzöbel OPkm 156.105 | 423 cm | in the highest 10 percent for the date | +6 cm |
| Quitzöbel UPkm 156.19 | 280 cm | within the normal range for the date | +13 cm |
| Rathenow OPkm 102.86 | 280 cm | within the normal range for the date | +5 cm |
| Rathenow UPkm 103.94 | 115 cm | within the normal range for the date | +3 cm |
| Tieckowkm 76.33 | 222 cm | within the normal range for the date | +4 cm |
| Trübengraben Polderkm 141 | 226 cm | in the highest 10 percent for the date | +7 cm |
| Warnau Polderkm 127.5 | 184 cm | within the normal range for the date | 0 cm |
| Pareyer Verbindungskanal | |||
| Parey EPkm 0.685 | 89 cm | in the lowest 5 percent for the date | +8 cm |
| Parey UPkm 0.85 | 307 cm | in the highest 10 percent for the date | +1 cm |
| Potsdamer Havel | |||
| Potsdamkm 26.63 | 93 cm | within the normal range for the date | -2 cm |
Keep exploring
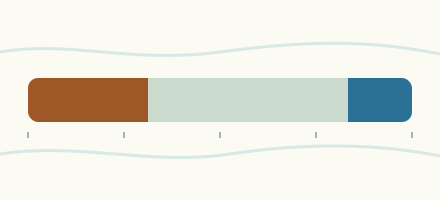 Country, Germany Are the rivers and lakes in Germany unusually low or high? Every river and lake we follow in Germany, against normal for the date.
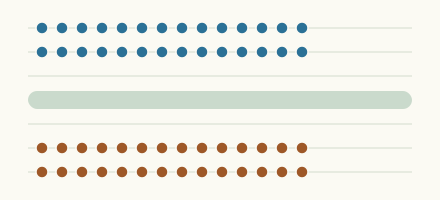 Today's list, Germany Which places in Germany are furthest from normal today? The places in Germany furthest below and above normal today.
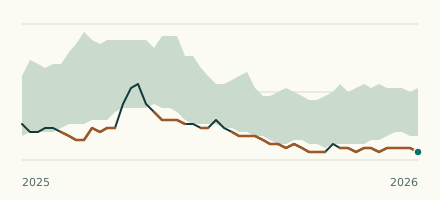 Waterway gauge, Germany Is the Lower Havel Waterway unusually low at Neuwerben EP? Level now, history, the same date in past years and each year's range.
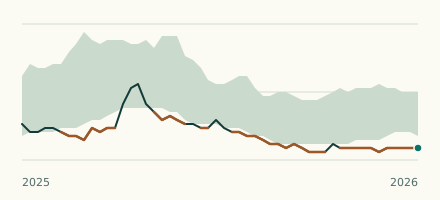 Waterway gauge, Germany Is the Lower Havel Waterway unusually low at Havelberg EP? Level now, history, the same date in past years and each year's range.