Bouches-du-Rhône département river levels today
Are the rivers and lakes in Bouches-du-Rhône unusually low or high?
We follow 21 water level gauges in Bouches-du-Rhône. 1 gauge reads below its normal range for the date and 2 gauges above it.
How many gauges do we follow in Bouches-du-Rhône?
21 gauges of the 3,078 we follow in France, as of 26 October 2026.
How many waters in Bouches-du-Rhône have a level gauge?
10 waters with a level gauge, of the 1,509 waters we follow in France, as of 26 October 2026.
How many gauges read below normal for the date?
1 gauge below its normal range, of the 12 gauges with a current reading and a normal range for the date, as of 26 October 2026.
How many gauges read above normal for the date?
2 gauges above their normal range, of the 12 gauges with a current reading and a normal range for the date, as of 26 October 2026.
How the places stand today
1 place below normal and 2 places above
Which places are furthest below normal?
Which places are furthest above normal?
Which gauges do we follow in Bouches-du-Rhône?
| Place | Reading | Against normal for the date | Change in a day |
|---|---|---|---|
| Arc (Bouches-du-Rhône) | |||
| Aix-en-Provence | 0.547 m | within the normal range for the date | -0.013 m |
| Berre-l'Étang | 0.74 m | ||
| Meyreuil | 0.915 m | in the highest 10 percent for the date | -0.005 m |
| Cadière | |||
| Marignane | 0.131 m | lower than any day of these dates in 42 years | -0.019 m |
| Durance | |||
| Mallemort | 1.329 m | within the normal range for the date | +0.358 m |
| Meyrargues | 0.461 m | within the normal range for the date | -0.014 m |
| Huveaune | |||
| Aubagne | 0.323 m | within the normal range for the date | -0.011 m |
| Marseille | 0.657 m | +0.005 m | |
| Roquevaire | 0.551 m | within the normal range for the date | -0.046 m |
| Jarret | |||
| Marseille | -0.045 m | -0.003 m | |
| Luynes | |||
| Aix-en-Provence | 0.337 m | within the normal range for the date | +0.004 m |
| Rhône | |||
| Tarascon | 1.46 m | within the normal range for the date | +0.40 m |
| Tarascon (Pont de Beaucaire) | 1.61 m | within the normal range for the date | +0.063 m |
| Ruisseau de Budéou | |||
| Lambesc | 0.133 m | 0 m | |
| Torrent du Fauge | |||
| Gémenos | 0.465 m | in the highest 5 percent for the date | 0 m |
| Touloubre | |||
| Aix-en-Provence | 0.286 m | -0.013 m | |
| Aix-en-Provence (La Glacière) | 0.247 m | -0.018 m | |
| Cornillon-Confoux | 0.52 m | -0.093 m | |
| La Barben | 0.314 m | within the normal range for the date | -0.015 m |
| Lambesc | 0.313 m | -0.011 m | |
| Salon-de-Provence | 0.442 m | -0.035 m | |
Keep exploring
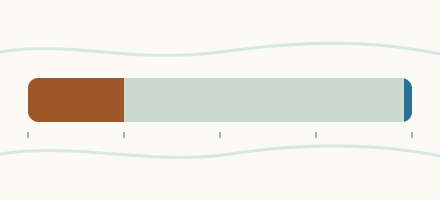 Country, France Are the rivers and lakes in France unusually low or high? Every river and lake we follow in France, against normal for the date.
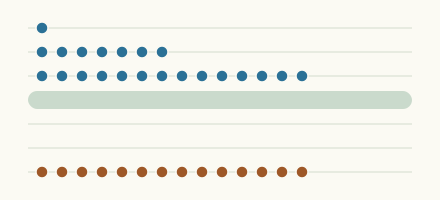 Today's list, France Which places in France are furthest from normal today? The places in France furthest below and above normal today.
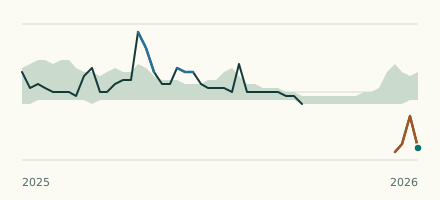 River gauge, France Is the Cadière unusually low at Marignane? Level now, history, the same date in past years and each year's range.
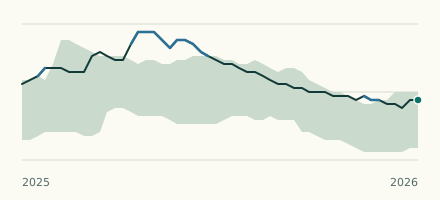 River gauge, France Is the Torrent du Fauge unusually high at Gémenos? Level now, history, the same date in past years and each year's range.
Sources
- Source : Hub'Eau / SCV, données PHyC (Licence Ouverte Etalab) (source). Licence: Licence Ouverte / Open Licence version 2.0