Miljøstyrelsen river levels today
Are the rivers and lakes in the Miljøstyrelsen unusually low or high?
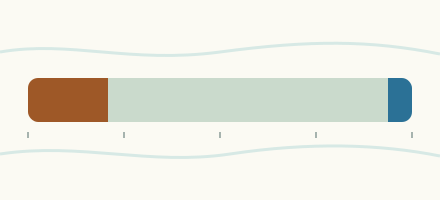
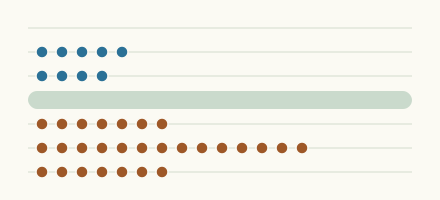
We follow 359 water level gauges in the Miljøstyrelsen. 24 gauges read below their normal range for the date and 6 gauges above it.
How many gauges do we follow in the Miljøstyrelsen?
359 gauges of the 580 we follow in Denmark, as of 21 November 2026.
How many waters in the Miljøstyrelsen have a level gauge?
311 waters with a level gauge, of the 467 waters we follow in Denmark, as of 21 November 2026.
How many gauges read below normal for the date?
24 gauges below their normal range, of the 108 gauges with a current reading and a normal range for the date, as of 21 November 2026.
How many gauges read above normal for the date?
6 gauges above their normal range, of the 108 gauges with a current reading and a normal range for the date, as of 21 November 2026.
How the places stand today
24 places below normal and 6 places above
Which places are furthest below normal?
More places
Which places are furthest above normal?
More places
Which gauges do we follow in Miljøstyrelsen?
| Place | Reading | Against normal for the date | Change in a day |
|---|---|---|---|
| Alslev å | |||
| V. Forumbro | 70.4 cm | -11.1 cm | |
| Andst Å | |||
| Ns Bro - Lundgårdvej | 42.9 cm | -4.9 cm | |
| Arnå | |||
| Arndrup | 113.4 cm | -2.3 cm | |
| Arreskov Sø | |||
| Tilløb 1 | 52.5 cm | within the normal range for the date | -0.6 cm |
| Tilløb 5 | 17.6 cm | within the normal range for the date | -0.7 cm |
| Arreskov Sø /skalapæl | |||
| Arreskov Sø /skalapæl | 49.6 cm | -1.2 cm | |
| Arresø | |||
| Arresø, Dalenborg | -13.4 cm | +0.8 cm | |
| Lærkevænget | 26.7 cm | in the lowest 5 percent for the date | -0.1 cm |
| Arresø Kanal | |||
| Arresødal Sluse | 122.6 cm | +2.7 cm | |
| Aulby Mølleå | |||
| Aulby | 39 cm | -5.4 cm | |
| Bagge Å | |||
| Ved Målestation 650 M Os Havet | 28.7 cm | -2.8 cm | |
| Binderup Å | |||
| Binderup Mølle, Ns | 99.5 cm | -3 cm | |
| Bjerndrup Mølleå | |||
| Afløb C2 | 62.6 cm | -0.2 cm | |
| T.T.Lille Søgård Sø | 125.3 cm | -6.5 cm | |
| Bjørnsholm Å | |||
| Vitskølkloster | 43.2 cm | +5.4 cm | |
| Blå Å (Lilleå) | |||
| T.T. Jels Oversø | 117.3 cm | within the normal range for the date | -7.3 cm |
| Bolbro Bæk | |||
| Basseklint | 63.6 cm | -1 cm | |
| Borre Å | |||
| Møllebro | 19 cm | within the normal range for the date | -1.1 cm |
| Borup Bæk | |||
| Sø. F. Lammestrup | 44.9 cm | -1.2 cm | |
| Boutrup Sø Afløb | |||
| 180 M Ns.Afløb | 41.8 cm | 0 cm | |
| Bramming-Holsted Å | |||
| Golfbanebro | 37.7 cm | within the normal range for the date | -12.1 cm |
| Brande Å | |||
| Hesselbjerge | 79.9 cm | -3 cm | |
| Brede Å | |||
| Bredebro | 141.6 cm | within the normal range for the date | -5.3 cm |
| Bredkær Bæk | |||
| Ns. Kærgård Mølle Dambrug | 14.6 cm | lower than any day of these dates in 27 years | -0.2 cm |
| Brende Å | |||
| St . 5.3 | 54.1 cm | within the normal range for the date | -1.2 cm |
| Årup | 85.5 cm | within the normal range for the date | -0.6 cm |
| Bryrup Å | |||
| Afløb Bryrup Langsø | 58.2 cm | -0.3 cm | |
| Brændemølle Å | |||
| V. For Bonderup Skov | 57.4 cm | -2.3 cm | |
| Brøns Å | |||
| Brøns V.Forsøgsdambrug | 193.1 cm | -7.5 cm | |
| Bygholm Å | |||
| Kørup Bro | 152.8 cm | in the highest 10 percent for the date | -16.2 cm |
| Sø Hjørne Af Bygholm Park I Horsens | 59.9 cm | -21.9 cm | |
| Bæk Nv For Ølgryde Plantage | |||
| Bæk Nv For Ølgryde Plantage | 21.8 cm | -0.6 cm | |
| Damhus Å | |||
| Slyk Bro | 90.5 cm | -2.3 cm | |
| Dumpedalsrenden | |||
| Vasevej | 23 cm | -0.9 cm | |
| Durup Bæk | |||
| 250M Os Udløb | 18.6 cm | -0.3 cm | |
| Dybdal Bæk | |||
| Tilløb Rørbæk Sø | 30.5 cm | -0.6 cm | |
| Egå | |||
| Lystrupvej, Vest For Lille Mosegård | 69.4 cm | 0 cm | |
| Ejby Å (Kvl.107) | |||
| V. Flækkebakke | 15.9 cm | -1.4 cm | |
| Ejstrup Bæk | |||
| Ved Sørup Bro | 29.8 cm | -0.6 cm | |
| Ellebæk | |||
| Ellebæk Bro | 22.1 cm | -2 cm | |
| Ellerup Bæk | |||
| Bæk, Ved Vejbro | 25.4 cm | -1 cm | |
| Elling Å | |||
| Elling Kirke | 86.8 cm | within the normal range for the date | -2.2 cm |
| Elsted Bæk | |||
| T.T.Genner Bugt | 82.4 cm | -1.5 cm | |
| Elverdams Å | |||
| Kildevang (Åsen) | 27.8 cm | -1.4 cm | |
| Elverdamsåen | |||
| V. Kragebro | 29.9 cm | within the normal range for the date | -1.9 cm |
| Engelsholm Bæk | |||
| N.Ø.For Engelsholm Slot | 37.1 cm | -0.8 cm | |
| Esrum Å | |||
| Ns. Jernbanebro | 52.1 cm | -4.1 cm | |
| Ørnevej | 38 cm | within the normal range for the date | -4.2 cm |
| Fald Å | |||
| Kokholm | 77.9 cm | -2.1 cm | |
| Fiskbæk | |||
| T.T.Flensborg Fjord | 92.1 cm | -7.5 cm | |
| Fiskbæk Å | |||
| Nybro Jernbanen | 37.4 cm | within the normal range for the date | -1.2 cm |
| Fjederholt Å | |||
| Donsig Bro I Skærbæk | 55.6 cm | -2.8 cm | |
| Fladmose Å | |||
| Dyssegård | 68.2 cm | within the normal range for the date | -1.7 cm |
| Fladså | |||
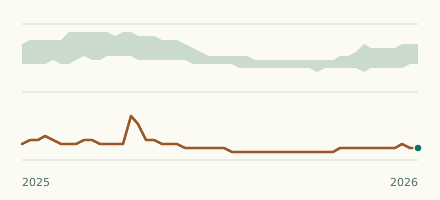
| Rettestrup | 119.2 cm | lower than any day of these dates in 24 years | -1.9 cm |
| Flynder Å | |||
| Bækmarksbro | 93.3 cm | -6.3 cm | |
| Funder Å | |||
| Funder St. | 53 cm | in the highest 5 percent for the date | -0.6 cm |
| Fåremølle Å | |||
| Fårevej | 46.1 cm | -2 cm | |
| Følstrup Bæk | |||
| Os Stenholts Mølle | 31.7 cm | -2.4 cm | |
| Gamst Møllebæk | |||
| Ved Styrt | 87.2 cm | -2.2 cm | |
| Ganer Å | |||
| Klostervej | 53.3 cm | -2.6 cm | |
| Garverrenden (Privat) | |||
| Langtved Landevej | 21.4 cm | -0.7 cm | |
| Geels Å | |||
| Geels Å, 3.45 | 47.7 cm | within the normal range for the date | -1.3 cm |
| Gelbæk | |||
| Rampes Møllevej | 16.5 cm | -1.4 cm | |
| Gels å | |||
| S For Enderupskov | 99.7 cm | within the normal range for the date | -5.7 cm |
| Gerå | |||
| Melholt Kirke | 71.6 cm | in the lowest 5 percent for the date | -7.7 cm |
| Gesager Å | |||
| Vejbro Vest For Korning | 57.4 cm | -11.2 cm | |
| Giber Å | |||
| Fulden (first gauge) | 30.6 cm | -3.1 cm | |
| Gjern Å | |||
| Jernbane Dæmning | 115.4 cm | -3.4 cm | |
| Gram Å | |||
| Petersholm | 80.9 cm | -5.2 cm | |
| Grindsted å | |||
| Ved Eg Bro | 125.9 cm | in the lowest 10 percent for the date | -3.3 cm |
| Gryde Å | |||
| Ssø For Sdr. Sognstrup | 66.2 cm | -1.8 cm | |
| Græse Å | |||
| V. Hørup, Lindebjerg | 87 cm | within the normal range for the date | -2.6 cm |
| Grønnebæk | |||
| Låddenbøg - Nørreskov | 80.8 cm | -3 cm | |
| Grønå | |||
| Rørkær | 129.2 cm | within the normal range for the date | -5.1 cm |
| Gudenå | |||
| 500 M Os Vorvadsbro | 15.4 cm | within the normal range for the date | -0.2 cm |
| Emborg Bro | 81 cm | -0.1 cm | |
| Møllerup | 41.1 cm | -0.3 cm | |
| Remstrupå, 100 M Nedstrøms Udløb Fra Papirfabrik | 19.6 cm | -1.2 cm | |
| Tinnet Bro | 58.8 cm | -0.5 cm | |
| Tvilumbro | 107.4 cm | within the normal range for the date | -1.4 cm |
| Ulstrup Bro | 87.3 cm | within the normal range for the date | 0 cm |
| Åbro | 66.3 cm | +0.7 cm | |
| Åstedbro | 61.8 cm | within the normal range for the date | -2.1 cm |
| Gudsø Mølleå | |||
| Sø For Sigvardsminde | 63 cm | -4.5 cm | |
| Haderslev Møllestrøm | |||
| Haderslev | 215.1 cm | -3.4 cm | |
| Hadsten Lilleå | |||
| Lige Ns Løjstrup Dambrug | 33.4 cm | within the normal range for the date | -6.6 cm |
| Hagensmølle Bæk | |||
| Ns Hagensmølle | 35.4 cm | -1.1 cm | |
| Hald Bæk | |||
| Lærkenborgvej | 27.5 cm | -0.4 cm | |
| Halkær Å | |||
| Bro Halkærvej | 28.4 cm | +1.2 cm | |
| Halsted Å | |||
| Pumpestation Indv. | 27.9 cm | -13.3 cm | |
| Harrested Å | |||
| Kramsvadgård | 26.6 cm | -2.6 cm | |
| Harrestrup Å | |||
| Landlystvej | 16.7 cm | within the normal range for the date | -11.8 cm |
| Haslevgårds Å | |||
| Træpælebro | 65 cm | within the normal range for the date | -5.7 cm |
| Hasseris Å | |||
| Frejlev | 79.7 cm | -1.2 cm | |
| Hattebækken | |||
| Vej Falsled-Jordløse (0.80) | 16.8 cm | -1.2 cm | |
| Haurbæk | |||
| 250 M Os. Søen | 78.5 cm | -0.2 cm | |
| Havelse Å | |||
| Strø Bro | 25.2 cm | within the normal range for the date | -4.4 cm |
| Havmølle Å | |||
| Stubbe Bro | 24.4 cm | +0.9 cm | |
| Hellegård Å | |||
| Tindskov Bro | 48.5 cm | -1.6 cm | |
| Hemmet Bæk | |||
| Nord For Hemmet | 57.2 cm | -2.4 cm | |
| Hennemølle Å | |||
| Bro Porsmosevej V. Henne Møllegård | 66 cm | within the normal range for the date | -2.5 cm |
| Herningsholm Å | |||
| Os. Storå | 22.7 cm | -3.3 cm | |
| Herredsbæk | |||
| Sv For Kludeegen | 88.2 cm | -2.2 cm | |
| Hessellund Bæk | |||
| Hessellundvej | 6.8 cm | -0.2 cm | |
| Hestbæk | |||
| Hestbæk Bro | 107.5 cm | +0.1 cm | |
| Hestetangs Å | |||
| Kalkværksbro | 19.9 cm | -0.8 cm | |
| Hinge Sø | |||
| Hinge Sø | 58.4 cm | -0.7 cm | |
| Hinge Å | |||
| Hinge Sø, Afløb V. Holmgård | 34.7 cm | -0.6 cm | |
| Hinnerup Å | |||
| Tindskov Bro, N For Østergård | 41.9 cm | ||
| Hodal Bæk | |||
| Idv. 579 - Ns Bro V.Skivevej | 35.9 cm | -0.4 cm | |
| Hodsager Lilleå | |||
| Ns. Hallundbækvej | 74.5 cm | +0.7 cm | |
| Holevad Bæk | |||
| 25 M Ops. Vej Ved Udløb | 16 cm | -0.1 cm | |
| Holstenhuus Afløb | |||
| Afl.F.Holsterhuus Gl.Dyrehave | 4.7 cm | -1.2 cm | |
| Holtum Å | |||
| Hygild | 51.1 cm | within the normal range for the date | -1.8 cm |
| Vejbro Nø For Åmejl | 60.8 cm | -2.7 cm | |
| Horndrup Bæk | |||
| Rørunderføring | 0 cm | 0 cm | |
| Sortholmvej LOOP 3 | 109.5 cm | within the normal range for the date | -3.4 cm |
| Hove å | |||
| S. F. Gundsøgård | 32.7 cm | within the normal range for the date | -0.3 cm |
| Hoven Å | |||
| V. Vejlevej/Sønder Grene Plantage | 81 cm | -3.9 cm | |
| Hover Å | |||
| Vejbro Syd For Hee | 29.8 cm | -3.1 cm | |
| Hulbyrenden | |||
| V.F. Billinge Banke | 31.1 cm | -3 cm | |
| Huleå | |||
| Os Rudbjerggård | 80 cm | -1.3 cm | |
| Hundstrup Å | |||
| St 6.86 | 42.3 cm | -2.7 cm | |
| Hvam Bæk | |||
| Gl. Hvam | 42.3 cm | -0.4 cm | |
| Hvidbjerg Å | |||
| Hvidbjerg Møllegård | 92 cm | within the normal range for the date | -0.5 cm |
| Hybæk | |||
| Hybæk Mølle | 27.5 cm | -2.9 cm | |
| Hylte Bæk | |||
| Afløb Ballen Rens., Os Nr. Vissing-Veng Vej | 26.1 cm | -1 cm | |
| Hågerup Å | |||
| Nedstrøms Hågerup | 27.6 cm | -1.5 cm | |
| Hårby Å | |||
| Hårby Å, 3.10 | 57 cm | within the normal range for the date | -4.1 cm |
| Højbro Å | |||
| V. Hanebjerggård | 25.7 cm | within the normal range for the date | -8.7 cm |
| Højen Å | |||
| Nederbro | 36.4 cm | within the normal range for the date | -3.4 cm |
| Idom Å | |||
| Idum | 48.6 cm | -1.2 cm | |
| Istrup Bæk | |||
| Istrup | 17.4 cm | -0.6 cm | |
| Javngyde Bæk | |||
| Os Rensningsanlæg | 18 cm | within the normal range for the date | -1.4 cm |
| Jeksen Bæk | |||
| Lige Opstr. Elstrup Dambrug | 40.6 cm | 0 cm | |
| Jordbro Å | |||
| Jordbro Mølle | 34.6 cm | in the lowest 5 percent for the date | -0.7 cm |
| Jydebæk | |||
| N. F. Bøgeholm | 104.3 cm | -6 cm | |
| Karstoft Å | |||
| Syd For Nr. Grene | 46.9 cm | -3.3 cm | |
| Karup Å | |||
| Hagebro | 54.7 cm | within the normal range for the date | -2.6 cm |
| Karup | 35 cm | -2.5 cm | |
| Nørkær Bro | 66.2 cm | within the normal range for the date | -1.9 cm |
| Kastbjerg Å | |||
| Ådalsvej | 28.8 cm | ||
| Kighanerenden | |||
| Caroline Mathildevej | 34.1 cm | -1.6 cm | |
| Kildebæk Vest For Nordre Bro | |||
| Kildebæk Vest For Nordre Bro | 29.6 cm | -0.3 cm | |
| Klostergrøften | |||
| Munkebro | 24.3 cm | -4.8 cm | |
| Knud Å | |||
| Bens. Møllevad Bro | 50.9 cm | +0.1 cm | |
| Sophiendal | 43.4 cm | within the normal range for the date | -2.3 cm |
| Kobbe Å | |||
| 250 M Opstrøms Vej Gudhjem-Svaneke | 30.9 cm | -2.4 cm | |
| Kogsbølle Bæk | |||
| Holckenhavn Nor | 19.8 cm | -0.9 cm | |
| Koholm Å | |||
| Flyndersømølle | 34 cm | -0.3 cm | |
| Kolding Å | |||
| Kolding By | 80.5 cm | -22.2 cm | |
| Kollerød Å | |||
| Uvelse Bro | 31.9 cm | within the normal range for the date | -5.7 cm |
| Kolå | |||
| Ved Nybro | 41 cm | -13 cm | |
| Konge Å | |||
| Kongeådal Bro | 216.9 cm | -9 cm | |
| Ved Konge Bro | 156.8 cm | within the normal range for the date | -10 cm |
| Kongshøj Å | |||
| Kongshøj Å, 6.05 | 62.4 cm | -5.3 cm | |
| Korup Å | |||
| Høgholt Bro | 36 cm | lower than any day of these dates in 24 years | -3.4 cm |
| Kragelund Møllebæk | |||
| Kragelund Møllegård | 19.4 cm | -0.8 cm | |
| Krogbæk | |||
| V. Krogbæksbro | 24 cm | -1.4 cm | |
| Kær Mølle Å | |||
| Till. T. Hejls Nor | 86.6 cm | -4.1 cm | |
| Kærs Mølleå | |||
| Os Indkildestrømmen | -2.5 cm | -2.8 cm | |
| Kærum Å | |||
| Møllerhuse | 29.2 cm | -0.2 cm | |
| Køge Å | |||
| V. Lellinge Dambrug | 14.4 cm | within the normal range for the date | -1.7 cm |
| Køng Å | |||
| Pumpestation Indv. | 80.9 cm | -13.2 cm | |
| Lammefjord Søkanal | |||
| Audebo | 20.1 cm | -10.5 cm | |
| Landsledgrøft | |||
| Slotshøj | 16.2 cm | -1.6 cm | |
| Langvad Å (east) | |||
| Storemøllebro | 29.4 cm | within the normal range for the date | -2.8 cm |
| Lerkenfeld Å | |||
| Lerkenfeld Møllegård | 49.5 cm | in the lowest 10 percent for the date | -1.5 cm |
| Lille-Hansted Å | |||
| Hansted, Lille Hansted Bro | 55.4 cm | -7.1 cm | |
| Lillebæk (north) | |||
| Vest For Lykkensprøve | 106.4 cm | -1.3 cm | |
| Lillebæk (south) | |||
| Fredskovvej | 27.4 cm | -0.6 cm | |
| Lilleå | |||
| Mølballe Bro | 48.6 cm | -1.6 cm | |
| Lindenborg Å | |||
| Lindenborg Bro | -12.3 cm | lower than any day of these dates in 39 years | -4 cm |
| Lindholm Å | |||
| Elkær Bro | 150.4 cm | within the normal range for the date | -11 cm |
| Lindved Å | |||
| Lindved Å, 1.20 | 18 cm | within the normal range for the date | -1.3 cm |
| Ll. Vejle Å | |||
| Pilemøllen | 44.1 cm | -3.2 cm | |
| Lollikebæk | |||
| Stensby Skov | 16.8 cm | -1.5 cm | |
| Lunde Å | |||
| Lunde Å, 7.25 | 27.7 cm | -2.7 cm | |
| Lyby-Grønning Grøft | |||
| Hulebro | 24.3 cm | -1.2 cm | |
| Lydum Å | |||
| Sdr. Lydum | 79.5 cm | -3.9 cm | |
| Lyngbro Bæk | |||
| Lyngbro | 83.4 cm | -5.7 cm | |
| Lyngby Å | |||
| Pumpestation | 61 cm | -1.2 cm | |
| Lyngbygårds Å | |||
| A 15 | 39.6 cm | -3.2 cm | |
| Lyså | |||
| Dmu Lysbro | 1.7 cm | -1.1 cm | |
| Lånum Bæk | |||
| Bækgård | 28.7 cm | in the lowest 5 percent for the date | -0.3 cm |
| Læså | |||
| Nedstrøms Viskeledsbro | 14.8 cm | -2.7 cm | |
| Mademose Å | |||
| S For Tørslev | 34.7 cm | within the normal range for the date | -1.7 cm |
| Maglemose Å | |||
| St.Valby V. Ågerupvej | 36.6 cm | within the normal range for the date | -12.7 cm |
| Marrebæk Kanal | |||
| Pst. Bøtø Nor Udvendig | 68 cm | -9.3 cm | |
| Mattrup Å | |||
| Afløb Fra Stigsholmsø | 61.8 cm | -0.5 cm | |
| Mausing Møllebæk | |||
| Ved Engbro | 67 cm | -1.9 cm | |
| Mergelsbæk | |||
| Fredenslund | 34.5 cm | -1.7 cm | |
| Mølleå | |||
| Afløb Furesø | 40.4 cm | +1.1 cm | |
| Stampen Mølle | 61.7 cm | within the normal range for the date | -3 cm |
| Nimdrup Bæk | |||
| St 2, 300M Nedstr. Kæmpesmølle | 52.5 cm | within the normal range for the date | -3.1 cm |
| Nive Å | |||
| V. Jellebro | 48.8 cm | within the normal range for the date | -9.5 cm |
| Nordkanalen 2F | |||
| Pst. Bøtø Nor Indvendig | 49.4 cm | -3.5 cm | |
| Nybølle Å | |||
| Nybøllevad Bro | 44.1 cm | within the normal range for the date | -0.9 cm |
| Nældevads Å | |||
| Strædeskov (32L) | 57.3 cm | within the normal range for the date | -5.7 cm |
| Næs Å | |||
| Pumpestation | 58.9 cm | +9.2 cm | |
| Nørre å (north) | |||
| Vejrumbro (first gauge) | 70.8 cm | -2.5 cm | |
| Nørreå (north) | |||
| Rindsholm Afløb Vedsø Os. Grundel Bæk | 19.5 cm | -0.2 cm | |
| Odder Å | |||
| Fillerup | 20.3 cm | within the normal range for the date | -1.4 cm |
| Sanderenggård | 33.7 cm | -3.7 cm | |
| Odderbæk (north) | |||
| Farsø Broen | 111.3 cm | -1.5 cm | |
| Hoveddrænstation | 15.5 cm | -0.8 cm | |
| Odderbæk (south) | |||
| Tillløb Kulsø | 11.5 cm | -1.4 cm | |
| Odense Å | |||
| Brobyværk | 90.6 cm | -8.2 cm | |
| Ejby Mølle, Ns Rens (St 8.45) | 90.8 cm | within the normal range for the date | -4.9 cm |
| Kratholm (22.35) | 92.2 cm | within the normal range for the date | -4.9 cm |
| Nørre Broby (St 35.80) | 96.7 cm | within the normal range for the date | -9.9 cm |
| Ops. Vibækrenden | 95.5 cm | -7.4 cm | |
| Omme Å | |||
| Farre | 49 cm | -7.9 cm | |
| Sønderskov Bro | 76.5 cm | within the normal range for the date | -4.8 cm |
| Onsild Å | |||
| Os Motorvej | 20.1 cm | -0.4 cm | |
| Puge Mølleå | |||
| Sandager Kirkemade (3.40) | 43.7 cm | -6.7 cm | |
| Pulverbæk | |||
| T.T.Mjang Dam, Als | 29.3 cm | -2.7 cm | |
| Pøle Å | |||
| Bendstrup | 48.8 cm | -4.4 cm | |
| Ramme Å | |||
| Vestermølle | 65.3 cm | -2 cm | |
| Rejsby Å | |||
| Vadehavet | 200.3 cm | -8.2 cm | |
| Resenkær Å | |||
| Dalgårdsvej | 44.4 cm | -1 cm | |
| Ribe å | |||
| V. Stavnager Bro | 74.1 cm | within the normal range for the date | -4.5 cm |
| Rind Å | |||
| Ved Kirkegården | 65.3 cm | -5 cm | |
| Ringe Å | |||
| Ringe Å, 3.05 | 25.8 cm | within the normal range for the date | -1.3 cm |
| Ringkloster Å | |||
| Klosterbro | -5.8 cm | -3.3 cm | |
| Rislebæk | |||
| Sollerup | 7.7 cm | -0.6 cm | |
| Rislebæk (Faaborg) | |||
| Nedst. Kaleko Mølle | 13.2 cm | -1.1 cm | |
| Rohden Å | |||
| 300 M Ns Årup Mølle Dambrug | 65.8 cm | -21.4 cm | |
| Romdrup Å | |||
| V. Lodsholm Bro | -7.1 cm | -2.5 cm | |
| Rosenvold Å | |||
| Ved Rosenvold Eng | 32.6 cm | -13.5 cm | |
| Ry Å | |||
| Manna | 26.8 cm | in the lowest 5 percent for the date | -11.8 cm |
| Ryde Å | |||
| Pumpestation Indv. | 93.9 cm | -16.1 cm | |
| Ryds Å | |||
| V. Gransangervej | 51.2 cm | -11.7 cm | |
| Ryå | |||
| Albæk. Fra Hunevej Til Ryå. | 76.6 cm | -9.5 cm | |
| Fristrupvej | 138.2 cm | -1.7 cm | |
| Rårup Å | |||
| Syd For Åstrupvej | 92.3 cm | -7.4 cm | |
| Råsted Lille Å | |||
| Hvodal | 37.5 cm | -1.8 cm | |
| Rævind Bæk | |||
| Vejbro Tårup - Sparkær | 19.5 cm | -0.6 cm | |
| Rævså | |||
| Ved Rørt, 5 M Opstrøms Vestlige Rørudløb | 22.8 cm | -3.2 cm | |
| Rødding Å (north) | |||
| Vejbro Ved Hestehave Gård | 24.3 cm | -2.1 cm | |
| Sallinge Å | |||
| Sallinge Å, 2.50 | 65.4 cm | -5.1 cm | |
| Salten Å | |||
| Rye Bro | 48.7 cm | -0.4 cm | |
| Saltenbro | 61.3 cm | in the highest 10 percent for the date | -1.4 cm |
| Saltø Å | |||
| Grønbro | 50.9 cm | -7.7 cm | |
| Ns. Harrested Å | 208.8 cm | -11.4 cm | |
| Sanderbæk | |||
| Asbæk, Ved Sander, Sydvest For Amhøj | 18.9 cm | -2.1 cm | |
| Savstrup Å | |||
| Bjerregård | 13.6 cm | -4.2 cm | |
| Seest Mølleå | |||
| Møgelmosehus - Os Kolding Å | 33.2 cm | within the normal range for the date | -5.8 cm |
| Sejbæk | |||
| Sjørup Plantage Øst | 30.3 cm | -0.1 cm | |
| Sillebro Å | |||
| Frederikssund | 28.1 cm | -0.5 cm | |
| Sillerup Bæk | |||
| Vadbro | 34 cm | -19.7 cm | |
| Simested Å | |||
| Skive-Hobro Landevej | 22.2 cm | lower than any day of these dates in 34 years | -2.1 cm |
| Skals å | |||
| Løvel Bro | 49.8 cm | in the lowest 5 percent for the date | -1.7 cm |
| Skensved Å | |||
| Øst For Lille Skensved | 41 cm | -4.9 cm | |
| Skive Å | |||
| Østerbro | 59.3 cm | +2.7 cm | |
| Skjellegrøften | |||
| Skjellerupgrøften | 32.8 cm | -0.1 cm | |
| Skjern Å | |||
| Alergård | 103.2 cm | in the lowest 5 percent for the date | -5.7 cm |
| Gjaldbæk Bro | 65.6 cm | in the lowest 5 percent for the date | -6.2 cm |
| Ns Kulsø | 33.2 cm | -1.1 cm | |
| Ns. Mes Sø | 50.1 cm | -1 cm | |
| Sandfeldvej | 63.2 cm | -5.1 cm | |
| Tykskov | -0.1 cm | lower than any day of these dates in 44 years | -0.6 cm |
| Skovmøllebæk | |||
| Ns Ejendom V. Dannerhøjvej 2 | 3.4 cm | -0.2 cm | |
| Skærbæk | |||
| Favrholt | 68 cm | -0.8 cm | |
| Skærup Å | |||
| Pjedsted | 120.7 cm | within the normal range for the date | -18.5 cm |
| Slotsmølle Å | |||
| Vest For Bro Ved Vestmarksvej I Aabenraa. | 17.8 cm | -1.6 cm | |
| Smørpøt Bæk | |||
| V. A11 | 20.7 cm | -0.9 cm | |
| Sneslev Lille Å | |||
| Sneslev | 57.1 cm | -2.7 cm | |
| Sneum å | |||
| V. Nørå Bro | 153.2 cm | within the normal range for the date | -9.9 cm |
| Solkær Å | |||
| Møllebro | 37.2 cm | -7.4 cm | |
| Spang Å (Bredstrup Å) | |||
| Bredstrup | 136.8 cm | in the highest 10 percent for the date | -14.5 cm |
| Spegerborgrenden | |||
| 50 M Os Renseanlæg | 24.7 cm | -0.7 cm | |
| Stampemølle Bæk | |||
| Opstrøms Odder Å | 30.6 cm | -5.4 cm | |
| Stavis Å | |||
| Stavis Bro (St 8.25) | 100.8 cm | in the highest 5 percent for the date | -5.4 cm |
| Stenderup Bæk | |||
| Bro Stenderup-Tobøl Landevej | 73.4 cm | -3 cm | |
| Stistrup Å | |||
| Stistrup Å | 37 cm | -1.4 cm | |
| Stokkebækken | |||
| Stokkebækken, 1.80 | 46.9 cm | within the normal range for the date | -7.8 cm |
| Stokvad Bæk | |||
| 100 M Os Udløb I Vegen Å | 26.8 cm | -0.4 cm | |
| Storå (central) | |||
| Bur Bro | 52.4 cm | -13.5 cm | |
| Laksestien | 86.7 cm | -7.5 cm | |
| Rotvig Bro | 10.9 cm | -7.3 cm | |
| Skærum Bro | 65.5 cm | within the normal range for the date | +0.1 cm |
| Ved Gl. Grydholt | 35.8 cm | in the lowest 10 percent for the date | -7.5 cm |
| Storå (north) | |||
| Kåstrup | 75 cm | -1.7 cm | |
| Storå (south) | |||
| Møllebro (4.6) | 60.7 cm | within the normal range for the date | -9.3 cm |
| Stubber Å | |||
| Ns Stubbergård Sø | 7.9 cm | -0.1 cm | |
| Stubberup Bæk | |||
| Hedegårdsvej | 22.7 cm | -0.3 cm | |
| Sunds Møllebæk | |||
| Gammel Sunds | 18.3 cm | -0.4 cm | |
| Suså | |||
| Pindsobro | 140.5 cm | -7.7 cm | |
| S.F.Holløse Bro | 49.4 cm | within the normal range for the date | +0.7 cm |
| Svenskebæk | |||
| Ca. 100 M Opstrøms Sammenløb Med Læså | 3 cm | -1.6 cm | |
| Svenstrup Å | |||
| Sv F.Hasselholtgård. | 48.7 cm | -1.9 cm | |
| Svinninge Å | |||
| Marke Bro | 46.7 cm | within the normal range for the date | -7.2 cm |
| Sæby Å | |||
| Hummelbro | 25.2 cm | -2.6 cm | |
| Søby Å | |||
| Afløb Søby Sø | 12.3 cm | -0.2 cm | |
| Søderup Å | |||
| Øst For Bro Ved Vejen Fra Ting | 78.3 cm | -4.6 cm | |
| Søholm Sø | |||
| Afløb | 54 cm | within the normal range for the date | +0.9 cm |
| Tilløb 1 | 67.2 cm | in the highest 10 percent for the date | -2.4 cm |
| Sønderå | |||
| Gerrebækvej | 124.1 cm | -5 cm | |
| Sørup Å | |||
| Lundby Bro | 53.6 cm | -1.8 cm | |
| Tange Å | |||
| Gl. Lundeborgvej | 15.8 cm | +1.5 cm | |
| Taps Å | |||
| Ved Rensningsanlæg | 45.8 cm | within the normal range for the date | -12.2 cm |
| Tarm Møllebæk | |||
| Kyvling Bro | 63 cm | -1.6 cm | |
| Tim Å | |||
| V. Sønderby | 51.6 cm | -4.6 cm | |
| Tingsted Å | |||
| 4F, Sønder Kohave | 44.3 cm | -4.9 cm | |
| Tjærbæk | |||
| Sukkertoppen | 15 cm | -0.7 cm | |
| Torpe Kanal | |||
| Storkebjerg | 99.3 cm | -0.4 cm | |
| Trappebæk | |||
| Karoline Amalie Lund Syd | 23.2 cm | -1.1 cm | |
| Trend Å | |||
| Fredbjerg Bro | 2.7 cm | in the lowest 5 percent for the date | -3.8 cm |
| Tryggevælde å | |||
| V. Ll. Linde | 23.5 cm | within the normal range for the date | -3.3 cm |
| Tudeå | |||
| Valbygård | 37.8 cm | within the normal range for the date | -5.6 cm |
| Ørslev | 125.6 cm | -3.4 cm | |
| Tudserenden | |||
| Vej Rudkøb.-Spodsb. | 21.8 cm | -2.1 cm | |
| Tuelå | |||
| Bulbro | 105 cm | -0.4 cm | |
| Tuse Å | |||
| Nybro | 169.4 cm | within the normal range for the date | -7.7 cm |
| Tvede Å | |||
| 50 M. Nedstrøms Udbyhøjvej, Ved Markvejsbro. | 16.8 cm | -0.6 cm | |
| Tåning Å | |||
| Ns. Fuldbromølle | 60.3 cm | +0.4 cm | |
| Tømmerby Å | |||
| Langvad Bro | 46.1 cm | in the lowest 10 percent for the date | -1.4 cm |
| Uge Bæk | |||
| Frestrup | 123.8 cm | -5.2 cm | |
| Uggerby Å | |||
| Astedbro | -9 cm | in the lowest 5 percent for the date | -15.7 cm |
| Ulstrup Å | |||
| Os Dræn Fra Campingplads | 8.1 cm | 0 cm | |
| Usserød Å | |||
| Nive Mølle | 18 cm | in the lowest 5 percent for the date | -3.1 cm |
| Varde Å | |||
| V. Vagtborg | 237.9 cm | within the normal range for the date | -16.9 cm |
| Vegen Å | |||
| Ns. Munkbrovej | 60.2 cm | -1.8 cm | |
| Vejerslev Bæk | |||
| Amsterdam | 51.9 cm | ||
| Vejle å | |||
| Afløb Engelsholm Sø | 57.6 cm | -1.1 cm | |
| Haraldskær (first gauge) | 82.5 cm | within the normal range for the date | -6.2 cm |
| Vejlesø Kanal | |||
| Opstrøms Furesø | 55.6 cm | +0.1 cm | |
| Vejrup Å | |||
| Skovhaven | 19.4 cm | -0.9 cm | |
| Vejstrup Å | |||
| Vejstrup Å, 1.80 | 36.9 cm | within the normal range for the date | -1.3 cm |
| Venner Å | |||
| Holmager | 47.8 cm | -1.3 cm | |
| Vester Kanal | |||
| Ns. Thistedvej | 79.4 cm | -2.1 cm | |
| Vester-Nebel Å | |||
| Elkærholm | 41.3 cm | -9.1 cm | |
| Viby Å | |||
| Viby Å, 2.90 | 38 cm | -2.8 cm | |
| Vidå | |||
| Emmerske | 309.7 cm | within the normal range for the date | -3.7 cm |
| Villestrup Å | |||
| Brøndbjerg Syd | 26.8 cm | -1 cm | |
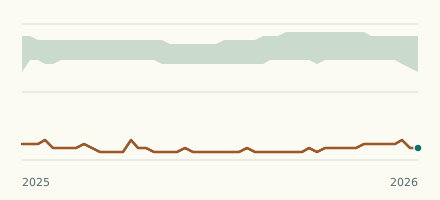
| V. Ouegård Bro | 70 cm | lower than any day of these dates in 32 years | -2.4 cm |
| Vindinge Å | |||
| Ns Ullerslev Rens. (9.90) | 23.5 cm | in the lowest 10 percent for the date | -2.1 cm |
| Vium Mølleå | |||
| Vium Mølle | 51.9 cm | within the normal range for the date | -1.1 cm |
| Vivede Mølleå | |||
| Ridebro | 20.1 cm | -1.8 cm | |
| Voel Bæk | |||
| Voel Bro | 16.7 cm | -0.5 cm | |
| Voer Å | |||
| Fæbroen | 33.7 cm | in the lowest 5 percent for the date | -11.5 cm |
| Vognstrup Bæk | |||
| Sv F. Meldgård | 21.9 cm | -0.6 cm | |
| Vorgod Å | |||
| Ved Egeris | 40.2 cm | -3.8 cm | |
| Værebro Å | |||
| Nedre Værebro | 44.2 cm | -4.5 cm | |
| V. Veksø Bro | 32.4 cm | within the normal range for the date | -9.3 cm |
| Å Å | |||
| Slotsmølle | 23.9 cm | ||
| Åkær Å | |||
| Ads Mølle | 51.4 cm | -3.3 cm | |
| Åmose Å | |||
| Bromølle | 45.4 cm | -5.5 cm | |
| Ugerløse Bro | 54.9 cm | within the normal range for the date | -7.3 cm |
| Århus Å | |||
| Ved Skibby | 35.7 cm | within the normal range for the date | -2.1 cm |
| Æbelholt Å | |||
| Søsterbro Mølle | 19.1 cm | -1 cm | |
| Øksenmølle Bæk | |||
| Søholt Skov, Opst. Dambrug | 7.6 cm | -0.8 cm | |
| Øle Å | |||
| Ns Vibebakke | 9.9 cm | -1.4 cm | |
| Sø For Boesgård | 9 cm | +0.1 cm | |
| Ølholm Bæk | |||
| Ølholm | 66.1 cm | -7 cm | |
| Ørbæk Å | |||
| Æbleskov | 21.6 cm | -0.1 cm | |
| Øster Tørslev Å | |||
| Øst F. Ågård | 40.1 cm | -2.7 cm | |
| Østerbæk | |||
| Sv For Stenstrupgård | 22.5 cm | -1.4 cm | |
Keep exploring
 Country, Denmark Are the rivers and lakes in Denmark unusually low or high? Every river and lake we follow in Denmark, against normal for the date.
 Today's list, Denmark Which places in Denmark are furthest from normal today? The places in Denmark furthest below and above normal today.
 River gauge, Denmark Is the Villestrup Å unusually low at V. Ouegård Bro? Level now, history, the same date in past years and each year's range.
 River gauge, Denmark Is the Fladså unusually low at Rettestrup? Level now, history, the same date in past years and each year's range.
Sources
- Danmarks Miljøportal (VanDa): Indeholder data, som benyttes i henhold til vilkår for brug af danske offentlige data (source). Licence: Danmarks Miljøportal terms for the use of Danish public data: free reuse, credit text required