Århus kommune river levels today
Are the rivers and lakes in the Århus kommune unusually low or high?
We follow 29 water level gauges in the Århus kommune. 1 gauge reads below its normal range for the date and 2 gauges above it.
How many gauges do we follow in the Århus kommune?
29 gauges of the 580 we follow in Denmark, as of 21 November 2026.
How many waters in the Århus kommune have a level gauge?
16 waters with a level gauge, of the 467 waters we follow in Denmark, as of 21 November 2026.
How many gauges read below normal for the date?
1 gauge below its normal range, of the 9 gauges with a current reading and a normal range for the date, as of 21 November 2026.
How many gauges read above normal for the date?
2 gauges above their normal range, of the 9 gauges with a current reading and a normal range for the date, as of 21 November 2026.
How the places stand today
1 place below normal and 2 places above
Which places are furthest below normal?
Which places are furthest above normal?
Which gauges do we follow in Århus kommune?
| Place | Reading | Against normal for the date | Change in a day |
|---|---|---|---|
| 26.82 | |||
| Århus Å | 177.7 cm | -2.1 cm | |
| Ballebæk | |||
| Ballebæk | 5,179.3 cm | -0.5 cm | |
| Brendstrupgrøften | |||
| Nedstrøms Bækhusvej | 4,619 cm | -1.1 cm | |
| Døde å - Brabrandstien | |||
| Døde å - Brabrandstien | 63.1 cm | -2.4 cm | |
| Døde å - Træbro | |||
| Døde å - Træbro | 87.3 cm | -13.3 cm | |
| Egå | |||
| Brovej | 12.5 cm | -0.1 cm | |
| Jernbanebroen | 46.7 cm | within the normal range for the date | -3.1 cm |
| Egå Engsø | |||
| Egå Engsø | 25.2 cm | within the normal range for the date | -0.3 cm |
| Egå Strand | |||
| Marina | 44.2 cm | in the highest 5 percent for the date | -11.3 cm |
| Egå Strandhusvej | |||
| Egå Strandhusvej | 9.4 cm | in the highest 5 percent for the date | +1.5 cm |
| Giber Å | |||
| Fulden (second gauge) | 948.4 cm | -2.9 cm | |
| Giber Å | 4,927.5 cm | -2.8 cm | |
| Ns Tingbro | 5,141.2 cm | -1.6 cm | |
| Testrupvej | 4,505.6 cm | -5.4 cm | |
| Lille Å Grusbjerg Skov | |||
| Lille Å Grusbjerg Skov | 4,203.1 cm | in the lowest 5 percent for the date | -0.8 cm |
| Løjenkær Bæk | |||
| Solbjerg Sø | 5,009.3 cm | within the normal range for the date | -0.6 cm |
| Skæring Bæk | |||
| Skæring Bæk | 70.8 cm | +0.1 cm | |
| Spørring Å | |||
| Ejsvad Bro | 4,030.5 cm | within the normal range for the date | -5.5 cm |
| Voldbæk | |||
| Voldbæk | 609.5 cm | -1.6 cm | |
| Århus Å | |||
| Afløb Årslev Engsø | 75.7 cm | within the normal range for the date | -1.1 cm |
| Aldrup Mølle | 4,868.7 cm | within the normal range for the date | +0.1 cm |
| De tre broer | 58.4 cm | -2.9 cm | |
| Museumsbroen | 44.5 cm | -10.9 cm | |
| Mølleparken | 46.1 cm | -12 cm | |
| Søren Frichs vej | 54.7 cm | -4.6 cm | |
| Træbro | 49.8 cm | -6.6 cm | |
| Udløb Århus Havn | 42.4 cm | -11.2 cm | |
| Viby ringvej | 64.7 cm | -2.1 cm | |
| Åby Renseanlæg | 57 cm | -3.7 cm | |
Keep exploring
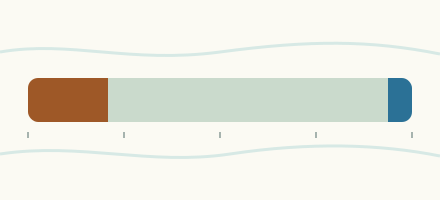 Country, Denmark Are the rivers and lakes in Denmark unusually low or high? Every river and lake we follow in Denmark, against normal for the date.
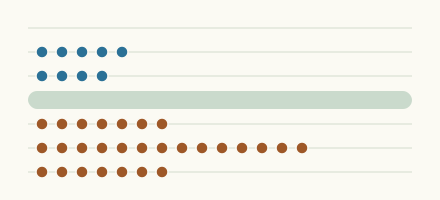 Today's list, Denmark Which places in Denmark are furthest from normal today? The places in Denmark furthest below and above normal today.
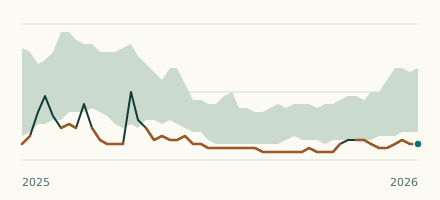 River gauge, Denmark Is the Lille Å Grusbjerg Skov unusually low at Lille Å Grusbjerg Skov? Level now, history, the same date in past years and each year's range.
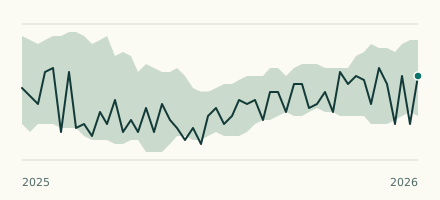 River gauge, Denmark Is the Egå Strand unusually high at Marina? Level now, history, the same date in past years and each year's range.
Sources
- Danmarks Miljøportal (VanDa): Indeholder data, som benyttes i henhold til vilkår for brug af danske offentlige data (source). Licence: Danmarks Miljøportal terms for the use of Danish public data: free reuse, credit text required