Quebec river levels today
Are the rivers and lakes in Quebec unusually low or high?
We follow 15 water level gauges in Quebec. 7 gauges read below their normal range for the date and none above it.
How many gauges do we follow in Quebec?
15 Water Survey of Canada level gauges of the 2,148 we follow in Canada, as of 26 October 2026.
How many waters in Quebec have a level gauge?
8 waters with a level gauge, of the 1,635 waters we follow in Canada, as of 26 October 2026.
How many gauges read below normal for the date?
7 gauges below their normal range, of the 15 gauges with a current reading and a normal range for the date, as of 26 October 2026.
How many gauges read above normal for the date?
0 gauges above their normal range, of the 15 gauges with a current reading and a normal range for the date, as of 26 October 2026.
How the places stand today
7 places below normal and 0 places above
Which places are furthest below normal?
Which gauges do we follow in Quebec?
| Place | Reading | Against normal for the date | Change in a day |
|---|---|---|---|
| Lac Saint-Louis | |||
| Pointe-Claire | 20.814 m | within the normal range for the date | -0.072 m |
| Lake Champlain | |||
| Philipsburg | 4.18 m | in the lowest 5 percent for the date | -0.03 m |
| Lake Memphremagog | |||
| Magog | 207.068 m | in the lowest 5 percent for the date | -0.001 m |
| Lake Timiskaming | |||
| Témiscaming | 5.034 m | within the normal range for the date | +0.046 m |
| Ville-Marie | 5.06 m | within the normal range for the date | -0.013 m |
| Ottawa River | |||
| Hull | 41.246 m | in the lowest 10 percent for the date | -0.023 m |
| Sainte-Anne-de-Bellevue | 21.415 m | in the lowest 10 percent for the date | -0.005 m |
| Sainte-Anne-de-Bellevue (marina) | 20.778 m | within the normal range for the date | -0.08 m |
| Terrasse-Vaudreuil | 21.392 m | in the lowest 5 percent for the date | -0.006 m |
| Richelieu River | |||
| Rapides Fryers | 0.717 m | within the normal range for the date | +0.01 m |
| Saint-Jean-sur-Richelieu (marina) | 0.184 m | in the lowest 10 percent for the date | -0.014 m |
| Rivière des Mille Îles | |||
| Bois-des-Filion | 0.80 m | within the normal range for the date | +0.003 m |
| St. Lawrence River | |||
| Lanoraie | 4.027 m | in the lowest 10 percent for the date | -0.059 m |
| LaSalle | 0.839 m | within the normal range for the date | -0.06 m |
| Pointe-des-Cascades | 20.905 m | within the normal range for the date | -0.067 m |
Keep exploring
 Country, Canada Are the rivers and lakes in Canada unusually low or high? Every river and lake we follow in Canada, against normal for the date.
 Today's list, Canada Which places in Canada are furthest from normal today? The places in Canada furthest below and above normal today.
 River gauge, Canada Is the Ottawa River unusually low at Terrasse-Vaudreuil? Level now, history, the same date in past years and each year's range.
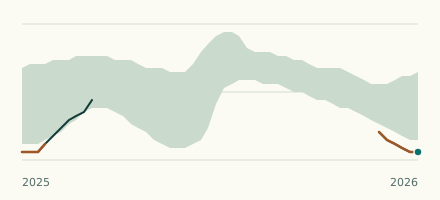 Lake gauge, Canada Is Lake Memphremagog unusually low at Magog? Level now, history, the same date in past years and each year's range.
Sources
- Data Source: Environment and Climate Change Canada (Water Survey of Canada) (source). Licence: ECCC Data Services End-use Licence v2.1.1